MINI WHITE PAPER OVERVIEW

PowerBI and Atlassian:
An alliance of two global communities

An Ukrainian strategist. A Nigerian Geologist. A Project Manager based in Sydney. A Danish entrepreneur and art collector. What do they all have in common? Their lives revolve around PowerBI, the Microsoft software that has flooded the world with impressive data visualizations… and one of the most common alternatives for exploring Jira datasets.

Part 1: The faces behind the data

The PowerBI boom
The PowerBI community is one of the most interactive, rich and global in the entire B2B landscape. Users share tips, tricks and best practices on the official forum as well as in various social media groups. Some private facebook groups for PowerBI users have over 50,000 members. The network of users stretches all over the world, with active communities in every continent: from North America to Oceania, from Denmark to Nigeria.

“You’re going to find 10 times more events online around PowerBI than around Tableau. People are looking for a product that will lead in the future, and I think that PowerBI will be the number 1 software for reporting, dashboards, and data analysis”, says Vahid, one of the experts that we interviewed.

Some of the reasons for this explosive adoption speak of convenience, together with the aggressive tactics that turned Microsoft into the technology behemoth of the 1990s. Low price point. User seeding with Office 365. The network effects of the use of Excel and PowerQuery as a data source.

But there are other reasons. PowerBI users are passionate about the tool, which for many of them has become a form of life.

We have interviewed some of them to share their story.

Segun Olatunbosun – Data analyst in Lagos, Nigeria

Segun Olatunbosun – Data analyst in Lagos, Nigeria

Segun is a lean, athletic young man from Lagos, Nigeria. He talks and answers fast, and is always up for a quick conversation where he can learn something new. When we talked, he was filled with enthusiasm about my enquiry to feature him for this piece. While he’s never been exposed to Atlassian tools, he was eager to understand anything he could about them – and I have the feeling that he would have welcomed a Jira training as much as I would enjoy an invitation to hike in a forest two years into my work from home life.
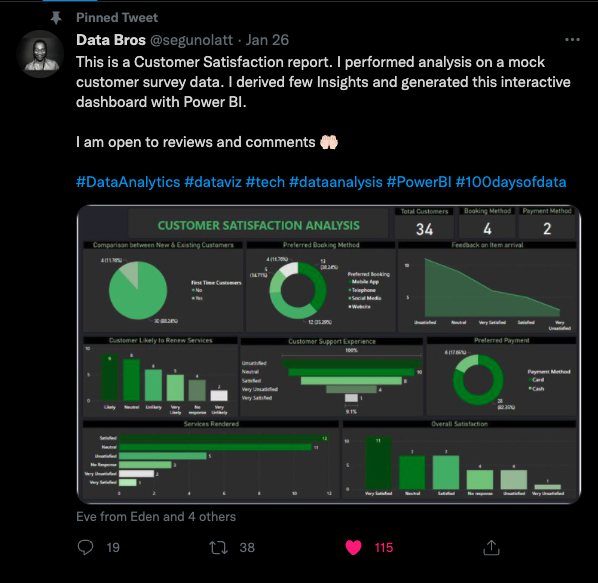
After finishing his studies in Geology, Segun enrolled in a 1 year tenure at an engineering firm called STEP DEVELOPMENT through the government program NYSC, where he was tasked with collating and monitoring data on building materials. That’s where he discovered his passion for crunching large datasets. He was fascinated by how much he could do with Excel, but craved for more:

I did a bit of research on how I could build a career on data analytics and decided to take online trainings and since then I’ve been able to build competencies in advanced Excel for analytics, foundation on Statistics, SQL for analytics including (Postgres, MYSQL, and Microsoft server SQL which is my favorite tool for exploring datasets.

His self-learning path awarded him an internship that marked his transition from geologist to data analyst at Quantum Analytics NG, a firm that trains future data analysts. There, he started working on different visualization assignments with Tableau and PowerBI. Some of them were based on really large datasets, like the New York City taxi trips between 2017 and 2020.

When I asked Segun why PowerBI is so powerful, he was very bold. “The obvious reason which I’m sure everyone agrees on is that it’s user friendly and easy to learn. But it’s also packed with more functionalities, like DAX expressions to navigate through the dataset, the custom visualizations you can download from the marketplace, and then also the option to share reports with people in your community”.

For Segun, the success of PowerBI is a combination of data processing marvels with a blossoming community. As he quickly discovered after his internship, visual dashboards are an incredible communication tool.

Every time he shares his work on twitter or LinkedIn, Segun engages with more and more people . “I didn’t expect it at all. You know, people have their own preferences and engage with what they find attractive, but I didn’t plan to be talking to experts from all over the world or to people like you about my analysis.”

Credit: Oluwasegun Olatunbosun
Credit: Oluwasegun Olatunbosun. We met on twitter when we found this great Customer Satisfaction Analysis

When he shared a customer satisfaction dashboard with mock data on twitter, Segun asked for feedback. Some of the comments just shared encouragement. However, most of them were specific suggestions, ranging from coloring and layout issues to different methodological aspects. A British Engineer pointed out at the right representation for satisfaction scores, with a Nigerian developer pointing out at the importance of starting from a hypothesis.

At this point of his life, Segun plans to become an expert data analyst in the future and is working at honing his skills even further to get there as soon as possible. However, the road is uncertain and difficult. As he confesses as we chat over DMs in twitter: “I wish I was in a better environment“.

You can get in touch with Segun on LinkedIn and twitter (segunolatt).

Vahid, the seasoned project manager

Vahid in a park in Sydney

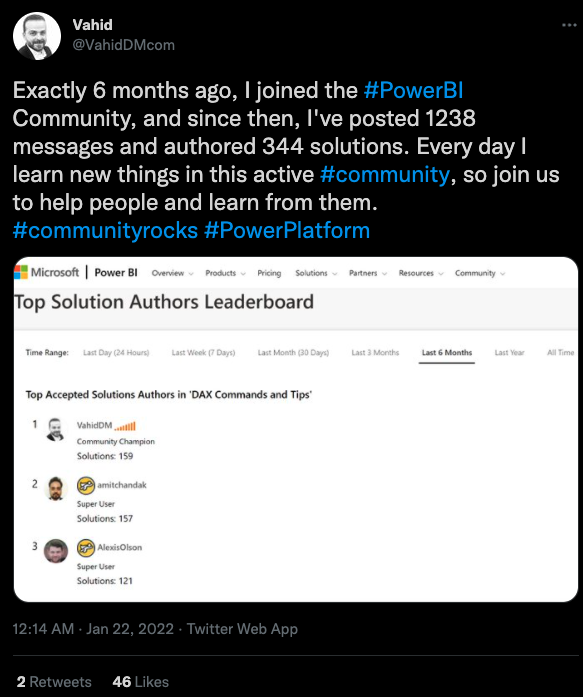
"My knowledge of PowerBI is 1%. Every day new features are shipped, there are new components and tools, you have to constantly improve and update what you’ve learned.” For Vahid, the PowerBI community is a lifelong learning journey. “When I decided that I wanted to work with PowerBI, I jumped into the official Microsoft community and started answering every question I saw that didn’t have an answer. I provided about 400 solutions in 7 months, 300 of which I had to research”. Vahid DM studied Industrial Engineering and has been working in project management for most of his career, but always enjoyed working with data. “When I was working in the planning field, I had to use Excel as my main professional tool and most of the time I was writing VBA (Visual Basic for Applications) and creating solutions. It’s very similar to what I do now with DAX”.

“When I was working in the planning field, I had to use Excel as my main professional tool and most of the time I was writing VBA (Visual Basic for Applications) and creating solutions. It’s very similar to what I do now with DAX”.

When joining Sydney Water’s project control team, his heart was already somewhere else. “I saw that a team here in Sydney was working with PowerBI and told them ‘guys, I’d love to join you!‘. After some time reading blogs, watching videos and answering questions I felt that I was ready to transition. I was fortunate enough to find a position where I serve as liaison between project managers and data teams, because I understand project management terminology, can interpret the data and know how to find it”.

Vahid knows that his work will be in constant evolution. “Every dashboard I create includes a feedback key where any stakeholder can send me comments, and many of the meetings we do to review the data end up with new requirements. A project manager may ask: ‘Why is that SPI that high’, and then we need to dig deeper”.

Currently, Vahid has decided to give back to his country of origin and is acting as admin of the Persian PowerBI user Group. “We’re just starting planning for some events, I want to give back and share knowledge with friends back home because I know just how much you can grow professionally when you go hand in hand”.

Experienced in hardcore PPM products like Primavera P6, Vahid smiles when asked about Jira. “Jira? I’ve never seen Jira, but whenever I see questions in the community it’s always the same problem: how do I connect to Jira?”

Erik, the entrepreneur

Erik Svensen

In many ways, Erik Svensen has a similar profile to Vahid. Both have their own personal websites where they blog about all things PowerBI. Both of them are PowerBI community leaders. And they’re established and recognized professionals.
However, there are also significant differences. Erik’s background is more deeply ingrained in the BI business. He has had his own consulting business since 2002. He owns a wine shop. And besides a Power Query enthusiast, he’s also an art collector.
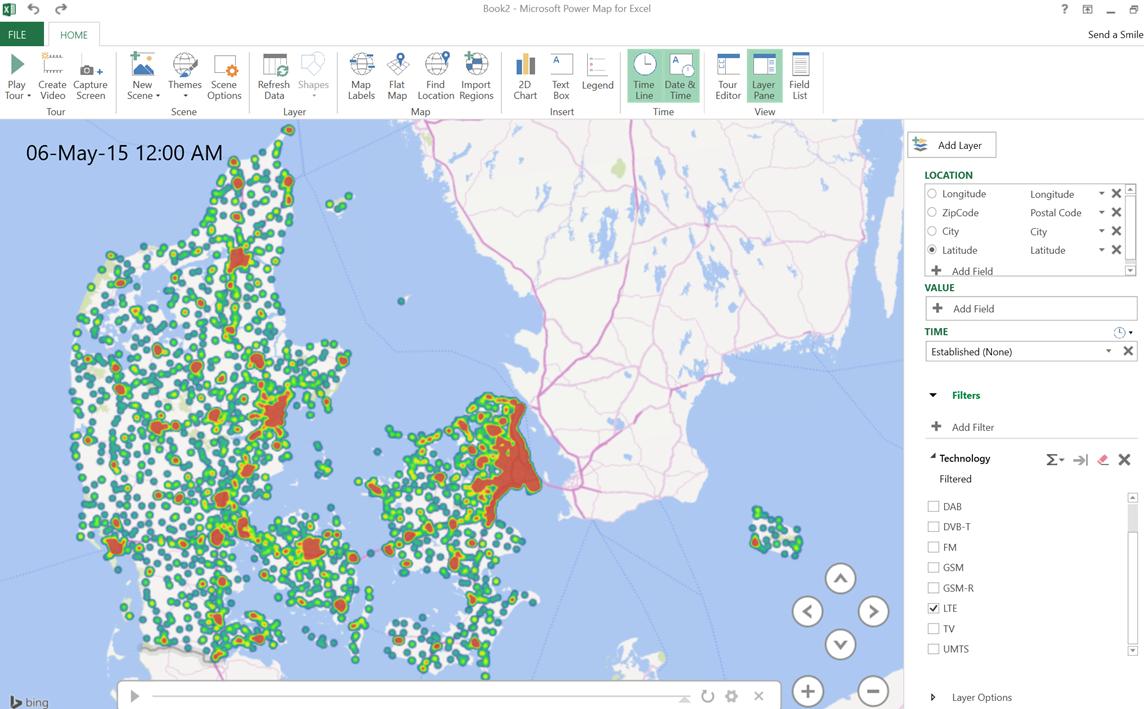
Erik didn’t have time for an interview with me. But he gently agreed to using his visualizations to illustrate this article.
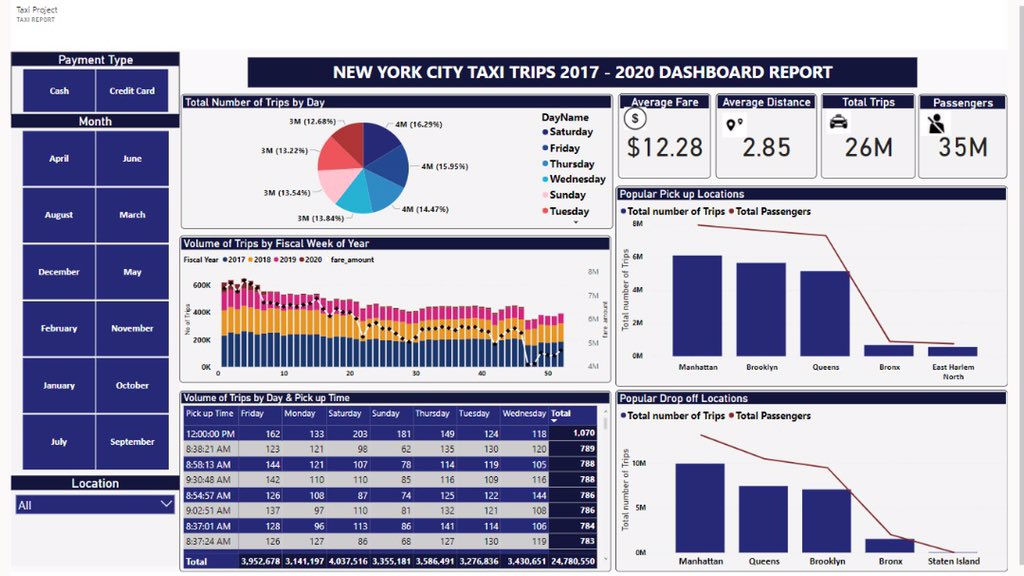
In the picture below, you can see a map of the Danish mobile network. And here’s a detailed walkthrough on how to set it up.

Credit: Erik Svensen @donsvensen

Erik’s work is a perfect example of the ecosystem of available alternatives for data analysts working with Microsoft tools, and how easy it is for an expert to build models and businesses based on them.

Part II: When PowerBI feeds from Atlassian sources

In fact, initiatives that use PowerBI to exploit data from Jira are not rare. Jira is not a reporting tool, and many of its customers look for additional ways to track, explore and analyze how their teams are working.

Jira visualizations in PowerBI: a crowded niche

The demand for Jira analysis done with PowerBI was so obvious from the beginnings that in October 2016 Microsoft launched the Jira Content Pack, with predefined KPIs and charts that allowed any Jira customer to explore their Jira datasets without the need to figure out the Jira API themselves.

Jira visualizations in PowerBI: a crowded niche
Credit: Erik Svensen @donsvensen
Of course, the market has changed a lot in the last few years, with the arrival of more and more options that can be plugged into PowerBI to create more interesting visual maps, like the Charticulator project from Microsoft research.
Credit: @Nsnapp

Projects based on Jira are common among consultants and experts specializing in data visualization with PowerBI. They’re also an excellent assignment for data analysis students who need hands-on scenarios and real life datasets.

In October 2020 Enterprise DNA, a consulting firm based in Auckland, devoted its 8th public challenge to Jira and received dozens of submissions. According to Brian Julius, Head Content Manager, the challenge was the company’s first intersection with Jira datasets.

“For our Data Challenges, we build the challenge around real-world business scenarios. In this case, we the IT department of a large office within the U.S. government submitted the ticket data, which was actually exported from Jira, just masked to prevent identification of the person submitting the ticket, and the persons servicing that ticket.“

While some of them produced a single dashboard with high level KPIs, others dived deep into some of the questions posed.

For example, this analysis by Mudassir Ali explored the peak periods for Jira Service Management agents.

The winner of the contest was Enterprise DNA Expert Greg Philps from Ottowa, Canada with a seemingly simple dashboard that hides a very sophisticated foundation.
The winner submission of the 8th Enterprise DNA Challenge
As Julius puts it, “it is beautifully constructed with an innovative navigational interface, one of the first instances of dynamic narratives seen in challenges at that point, an unusual ring chart that was originally built in Python, but subsequently was rewritten by Greg in Deneb, due to its better performance and the fact that it supports Publish to Web, while Python visuals do not.”

The PowerBI Connector for Jira

In 2019 Alpha Serve, a software development company from Kyiv, was looking for niches in the Atlassian Marketplace, which it had entered only 1 year earlier. When they realized that so many companies were building custom connectors to explore their Jira datasets, it was clear that they had found a golden opportunity.

Update:
This article was finished before the Russian invasion of Ukraine that started on February 24 2022. After the invasion begun, I exchanged a couple of quick messages with Anna over LinkedIn. She explained how she had been woken up at 5am to the sound of bombs and stressed the importance of being able to continue their business operations.

Two weeks into the war, I received news that Anna is safe in the Italian city of Turin. But her husband stayed to defend the homeland.

Anna Odrinskaya, Chief Strategy officer and Co-Founder at Alpha Serve

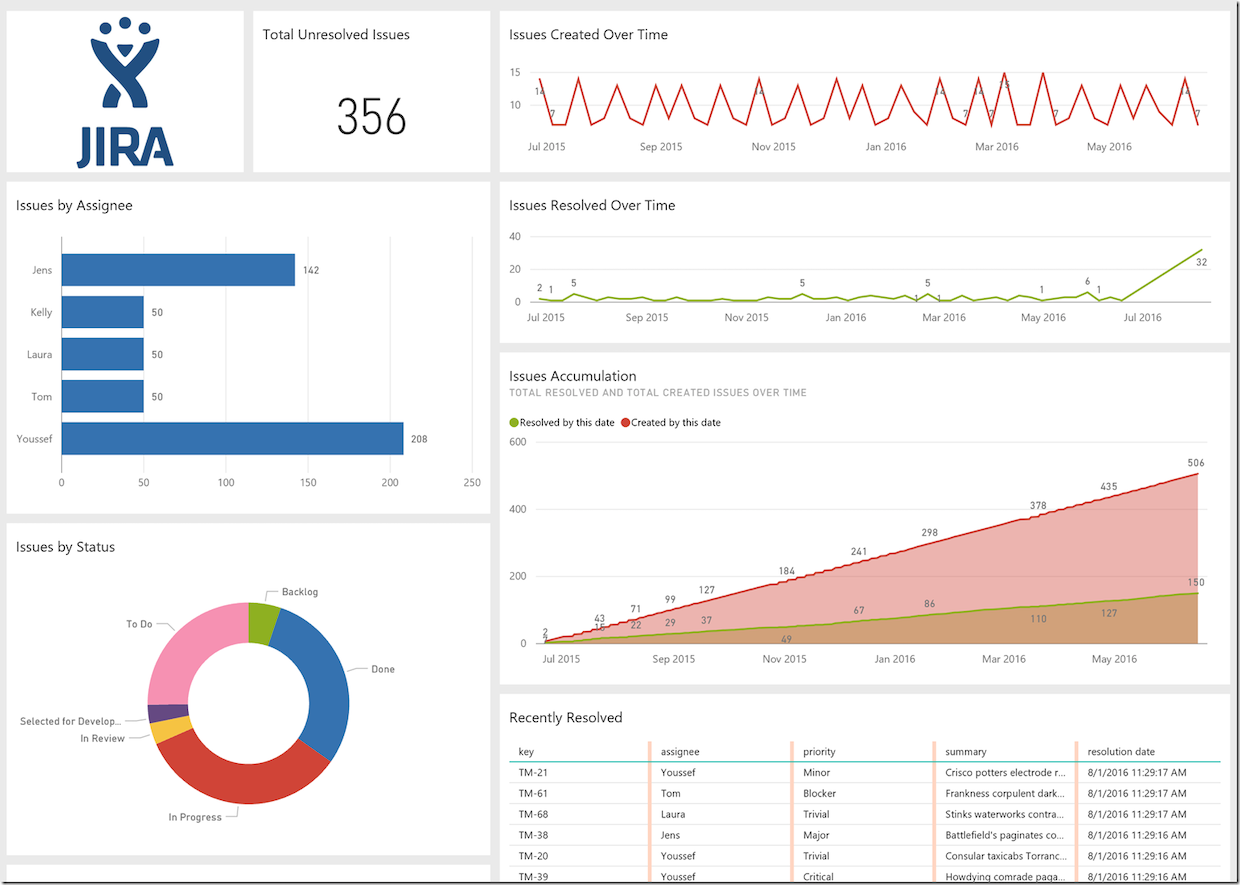
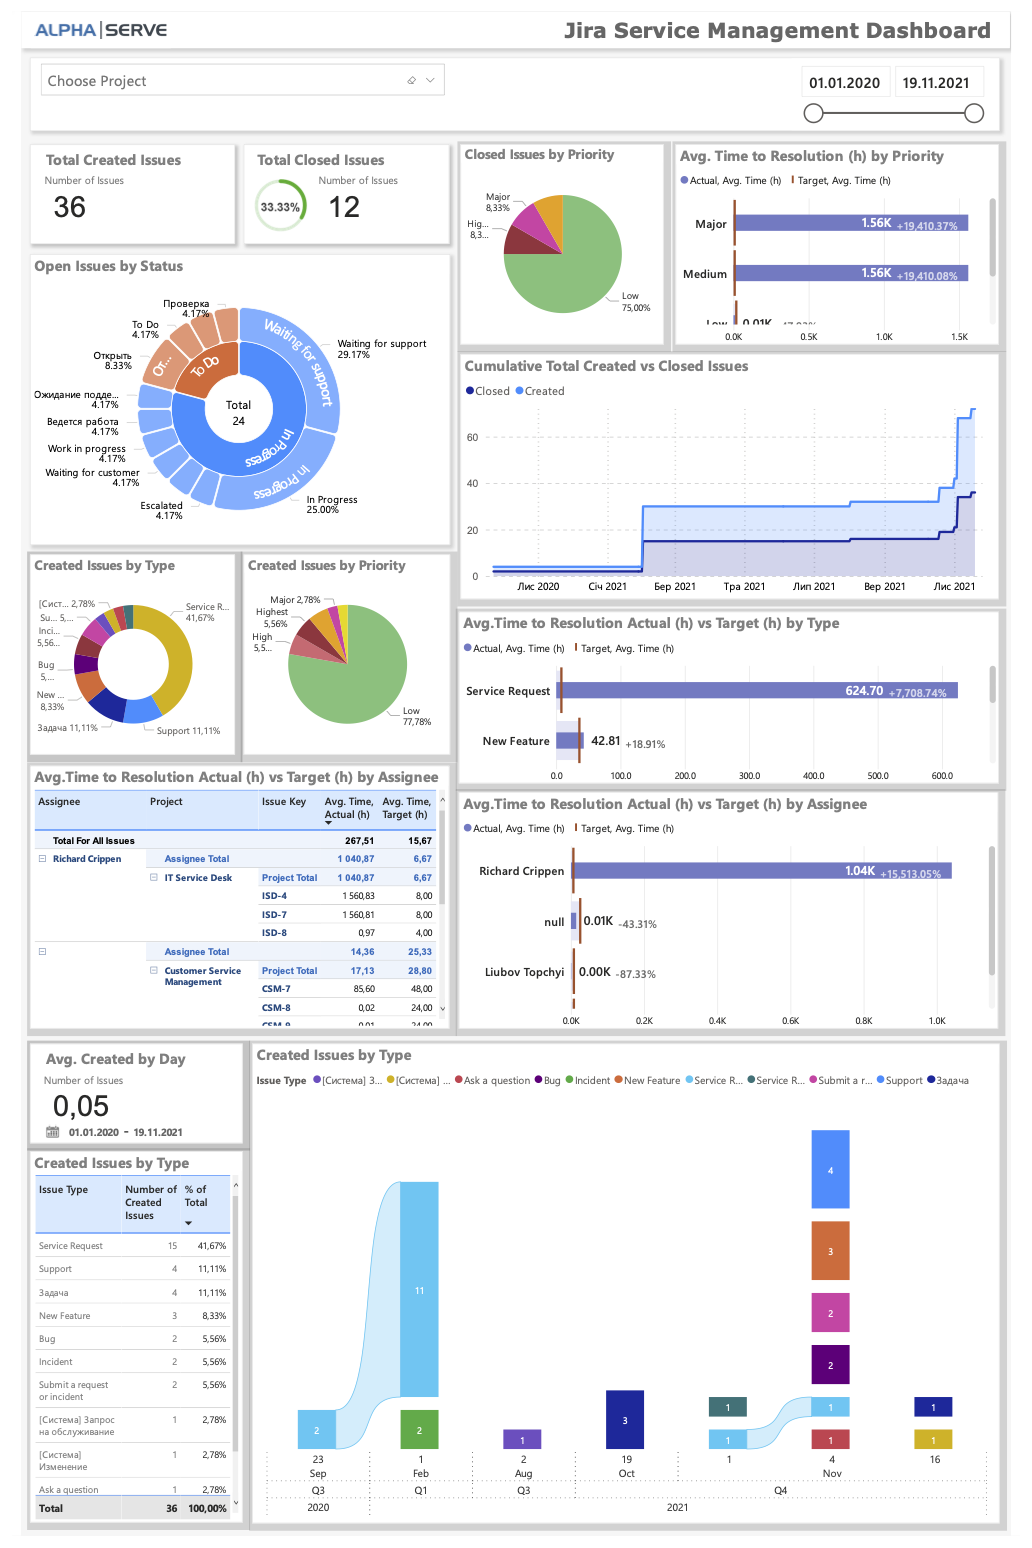
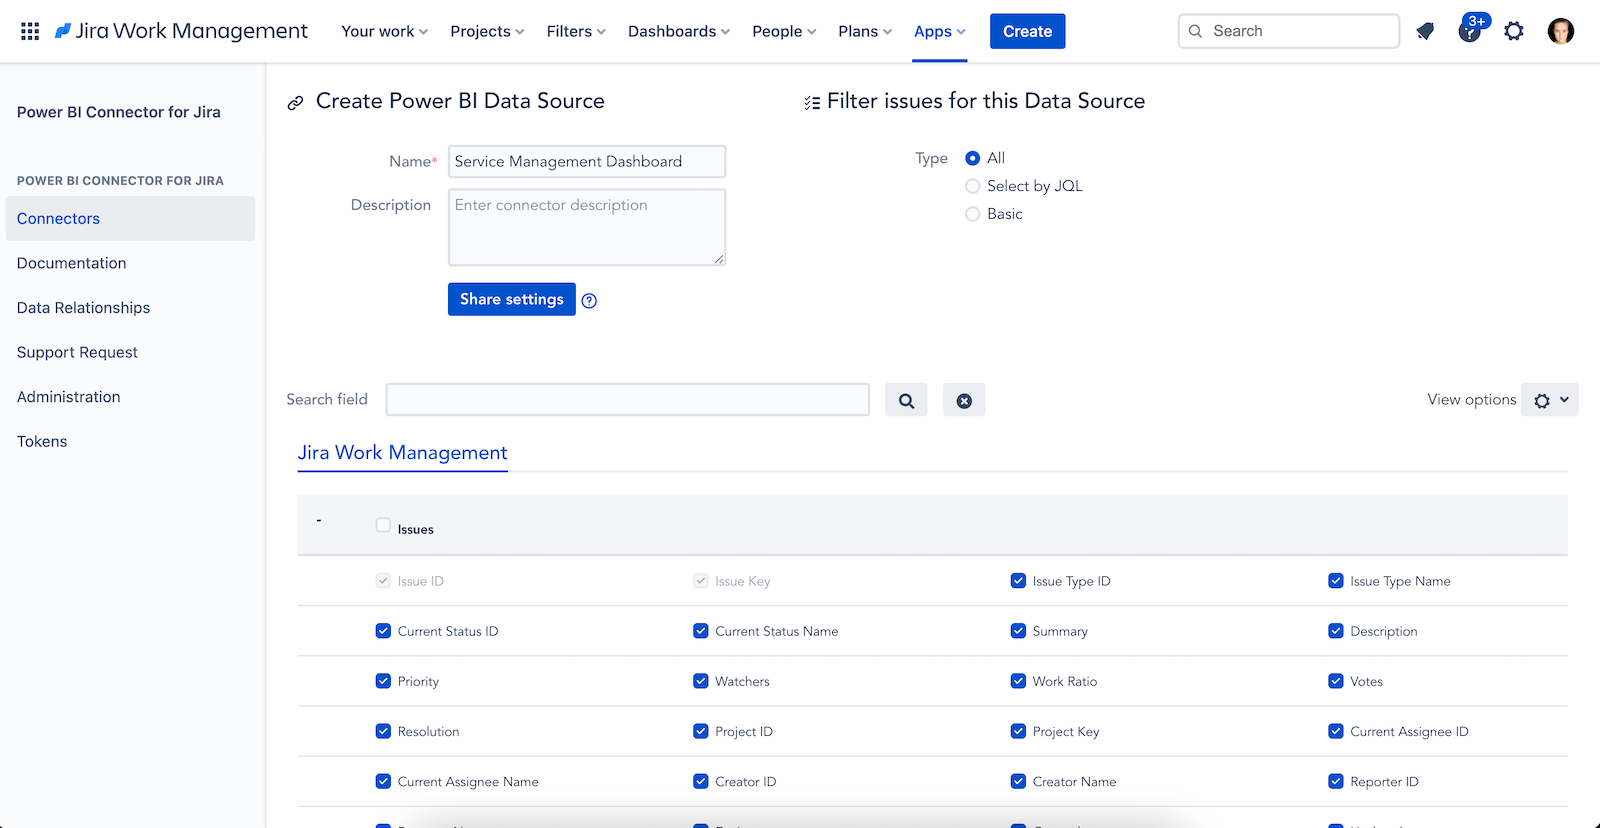
According to Chief Strategy Officer and Co-Founder Anna Odrinskaya, “over the last years we have specialized in BI connectors for different marketplaces, like Shopify for example. PowerBI Connector for Jira was the first of them all – and it’s quite impressive how the market keeps growing. The native reporting in Jira is very limited so that’s a very important driver. If you want anything minimally sophisticated or simply a dashboard with key project metrics rather than separate reports, you need to look for it somewhere else. It’s difficult to get the big picture”.

A classic Jira report showing created issues vs resolved issues
Cumulative flow diagram built with an Alpha Serve template

In less than two and a half years, Alpha Serve’s connector has collected over 2,000 installations from Atlassian customers around the globe. Competition within the Marketplace is fierce and customers don’t lack external alternatives:

“Some companies prefer to develop their own connectors because they are looking for specific customizations that a product can never accommodate out of the box, but for most of the companies out there we provide a lot of value and far more possibilities to generate Jira insights than the Jira Content Pack, which has become a bit obsolete”.

However, growth didn’t happen overnight. The team had to overcome major challenges.

“At the beginning, we had a lot of people evaluating the app, but very few of them converted. I think it was as frustrating for us as it was frustrating for them. After some research, we realized that very few actually understood the structure of the data that they were exploring, so they were basically flying blind and didn’t see any value. We had to make sure that users were able to understand how Jira data is architectured from the get-go”.

Had Alpha Serve not internalized that insight, the app would simply have had a silent flop. Instead, the development team overhauled the UI to better educate users.

Based on their revamped product, Jira admins tasked with the mission of exploiting data can quickstart with existing templates and create complex dashboards with a fraction of the effort that is needed for custom visualizations.

Jira Service Management Dashboard built with AlphaServe’s Connector for PowerBI

From insight creation to distribution: Embedding reports in Confluence

Alpha Serve customers obtain insights faster than their competitors. But they still face significant challenges, some of which are tied with the principles on which Jira is built.

Data contained in a report depends on who created it. Jira permissions affect what you can get from the API, so the same report will be different when published by two users with access to different projects. For example, a product manager with access to every project pertaining to their product portfolio will get a lot more data than an individual collaborator who has been added to only one of those projects.

This can be counterintuitive, but is an important safeguard to protect confidential information and make sure that managers are not misguided by data that doesn’t apply to their sphere of influence.

The experience of building a report with Alpha Serve’s Connector makes this form of data inequality even more obvious. Without the right permissions, some users simply can’t select data sources on the Jira side…

A privileged user can select data sources from multiple Jira applications and apps…
…while a project lead in Jira Work Management can only draw on data from JWM
Or load them on the PowerBI side.

Some customers are starting to publish their dashboards in Confluence with Marketplace apps like resolution’s Microsoft PowerBI Embed for Confluence.

resolution’s and Alphaserve’s products are compatible, streamlining the publication of powerful Jira insights in Confluence, as can be seen in this video:

Protecting information with the right permissions

Another benefit of this combination of Power BI connectors for Confluence and Jira has to do with securing information.

Unfortunately, replicating the structure of Jira permissions in PowerBI can be cumbersome. Once reports are in PowerBI, they can potentially be shared with anyone. This can lead to circumventing company policies, disseminating confidential info, or simply oversharing. 


Sharing dashboards in Confluence can be a reasonable remedy. Since Confluence is based on the same access and group management principles, this tactic makes it really easy to align access permissions. It’s enough, for example, to publish reports on Software Development projects in the Confluence Space used by the development team. 

“We’re seeing this as one of the main benefits of the app” says Björn Döhler, Co-CEO at resolution and product manager of the connector for Confluence. “There’s no real difference in the user experience when you browse PowerBI dashboards in Confluence, besides the fact that you’re making sure I can only see what I’m supposed to see. There’s no noise, no distractions, and no confidentiality issues”.

A bright future for Atlassian and PowerBI users

For many users, PowerBI has become a driver for change and an opportunity for specialization, education, and growth. For companies, it has become the most widely available, affordable yet powerful application to sustain a data-driven management style. For Atlassian customers, it’s already becoming a major opportunity to better understand how their teams are working.

As Jira and PowerBi become the de facto standard tools for work management and business reporting, the intersection between their user bases is expected to grow exponentially. Companies like resolution, Alpha Serve, and EnterpriseDNA will make sure that these customers are in good company and can obtain the business insights that their leaders crave.