
Understanding Your Workflow's Hidden Language
Ever wonder why some Jira tickets zip through your workflow while others get stuck in limbo? Think of Jira time in status as a vital sign monitor for your projects. It constantly tracks where work resides, how it progresses, and where it might be stalling.
This seemingly simple metric can reveal hidden patterns that significantly impact team productivity. It's like having a secret decoder ring for your projects.
This isn't about simply counting hours; it's about understanding the narrative within your data. Imagine a ticket spending an unusually long time in "Code Review." Is this a sign of meticulous quality control or a bottleneck that's slowing everything down? Time in status helps you answer these critical questions.
It's about identifying trends and extracting valuable insights that can dramatically improve project management. For instance, your data might reveal that certain tasks take longer after a new team member joins. This information can highlight training needs or process adjustments to get everyone up to speed.
Why Time in Status Matters
Jira time in status data is a goldmine of actionable intelligence. It helps you:
- Identify Bottlenecks: Pinpoint those frustrating areas where work piles up and diagnose the root causes of delays.
- Optimize Processes: Refine workflows based on the actual time spent in each stage, not just estimates.
- Improve Predictions: Forecast project timelines more accurately using historical data, like predicting the weather based on past patterns.
- Boost Team Performance: Identify skill gaps or areas where additional support can improve team efficiency.
Jira Software is a popular choice across various industries, handling everything from app development to general productivity. In fact, over 78,013 companies are projected to use Jira Software for application development by 2025, and more than 76,783 for productivity. This widespread adoption highlights the platform's versatility and the importance of leveraging its features like time in status tracking. For more Jira usage insights, check out 6sense.
From Spreadsheets to GPS: Transforming Time Tracking
Many teams still rely on cumbersome spreadsheets for time tracking, a process that's prone to errors and eats up valuable time. However, Jira time in status offers a more efficient and powerful approach.
Think of it as a built-in GPS for your workflow. It provides real-time location data for each task, eliminating manual data entry and guesswork. With this level of accuracy, project managers can make informed decisions, anticipate potential roadblocks, and keep projects on track.
Learning to interpret this data empowers you to shift from reactive problem-solving to proactive planning, leading to smoother project execution and better outcomes. This change in perspective helps teams become more efficient and deliver projects on time and within budget.
How Jira Actually Captures Time (The Real Story)
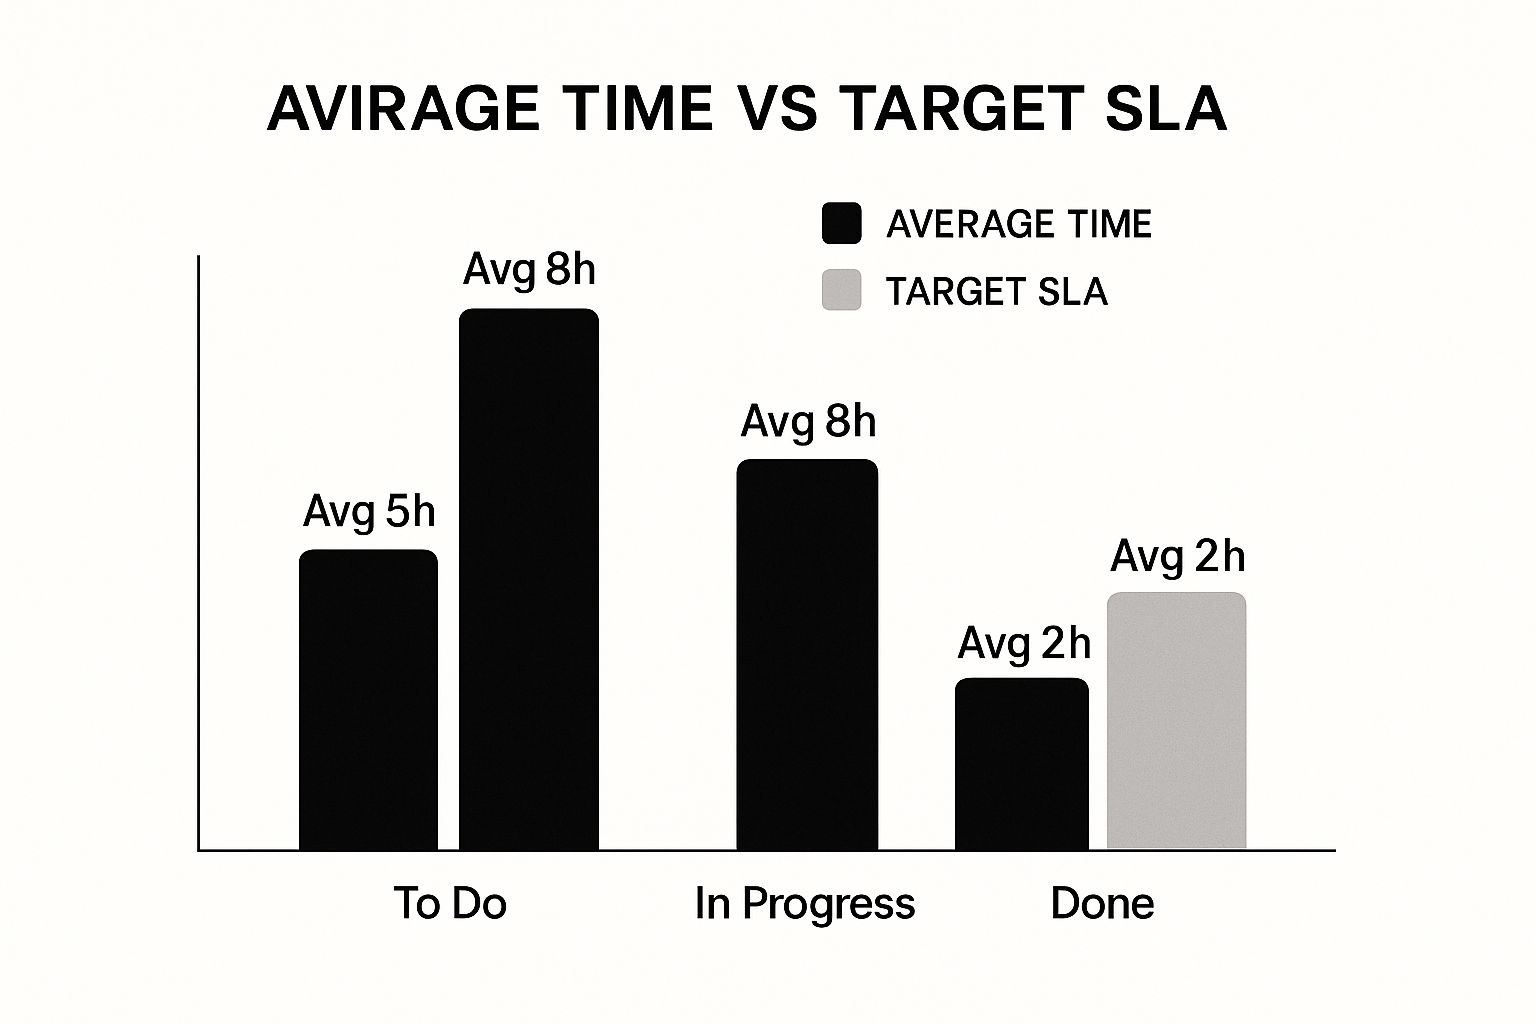
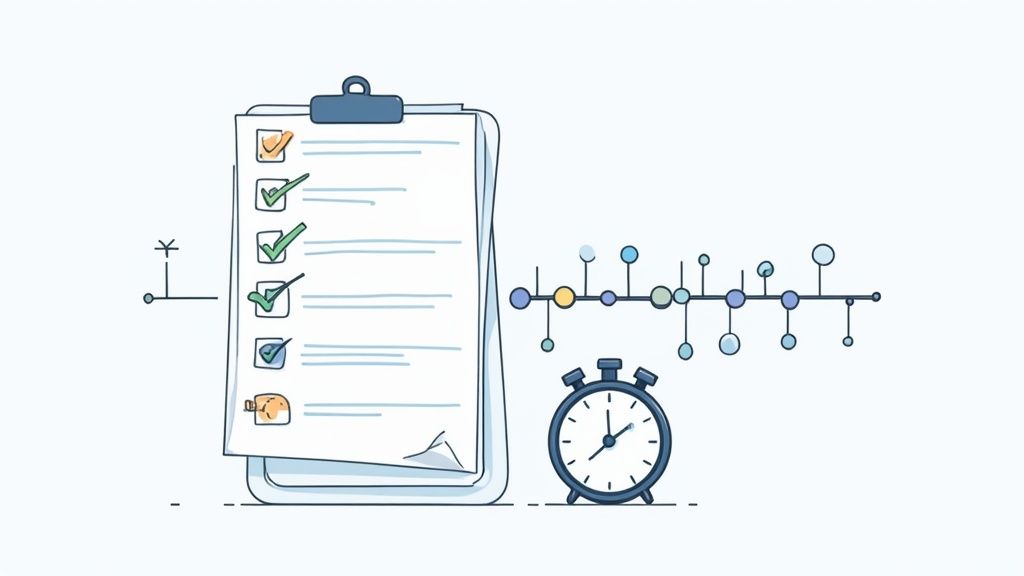
The infographic above gives us a snapshot of the average time spent in each status (To Do, In Progress, Done) compared to the target Service Level Agreement (SLA). Notice how "In Progress" is significantly over the SLA target. This is a strong visual cue that a bottleneck might exist in this stage.
Think of your Jira tickets as travelers, and their timestamps as passport stamps. Each time a ticket’s status changes – from "To Do" to "In Progress," for instance – Jira meticulously logs the exact moment of that transition.
But Jira's timekeeping is more than just a simple stopwatch. It understands the difference between calendar time (the total time elapsed) and working hours, which takes into account your team's work schedule and holidays. This is a vital distinction for accurate reporting.
Understanding Jira's Time Tracking Mechanism
Jira tracks time in status by recording a timestamp every time an issue changes status. This creates a detailed log of each transition, allowing for precise calculations of how long each stage actually takes. Over time, this historical data paints a rich picture of your workflow's performance.
For example, let's say a ticket goes from "To Do" to "In Progress" at 10:00 AM and then to "Done" at 2:00 PM. Jira diligently notes these transitions. It calculates four hours spent "In Progress." Unless you configure it otherwise, this calculation doesn’t automatically consider weekends or non-working hours. Understanding time in the context of your operational workflow is key, much like understanding expenses within a specific economic context, as illustrated in Understanding Your Expenses in Morocco.
Why Accurate Time Tracking Is Crucial
Accurate time in status data in Jira is the foundation for smart decision-making. It empowers you to identify real bottlenecks, optimize workflows based on evidence, and forecast project timelines with greater certainty. For a more robust approach to absence management, consider integrating tools like the Tempo Planner Out of Office for Jira.
Many teams stumble when it comes to understanding time tracking. They might overlook the difference between calendar time and working hours, leading to inaccurate reports. They might also assume that Jira automatically accounts for holidays, which it doesn’t without the right configuration. Understanding these subtleties is what separates teams who gain true insights from those who rely on misleading data. This technical understanding helps teams pinpoint areas that need improvement and prioritize those efforts.
Let's look at a comparison of different Jira time tracking methods:
To help illustrate the differences between various time tracking approaches within Jira, the following table summarizes key aspects of each. This comparison will clarify the best use cases for each method, depending on your specific needs.
Jira Time Tracking Methods Comparison
| Method | Accuracy Level | Setup Complexity | Best Use Case |
|---|---|---|---|
| Manual Time Entry | Moderate (Prone to human error) | Low | Tracking individual contributions, simple projects |
| Time Tracking with Worklogs | High | Moderate | Detailed time tracking for specific tasks and activities |
| Time in Status Tracking | High (for workflow analysis) | Low | Analyzing workflow efficiency, identifying bottlenecks |
| Automatic Time Tracking (using apps) | High (automated data capture) | Moderate | Large projects, teams needing automated time capture |
As you can see, each method provides a different level of accuracy and complexity. Manual time entry, while simple, is prone to human error. Worklogs are better for capturing specifics, while Time in Status offers workflow insights. Automated solutions are ideal for large projects needing efficient time capture. Choosing the right method depends on your project's needs and the level of detail required.
Decoding What Your Time Data Actually Means
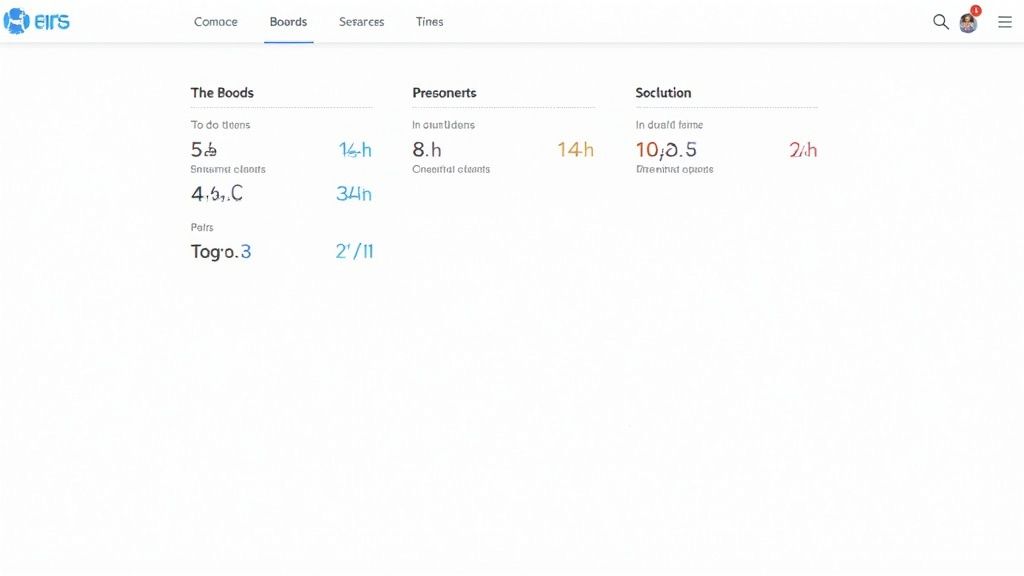
This screenshot shows a typical Jira project. See how many different statuses a ticket passes through? Tracking the time spent in each status gives you valuable clues about your team's workflow.
Think of your Jira time in status reports as an X-ray for your workflow. They reveal what's really going on under the hood. But just like a doctor interpreting a scan, you need to know how to read the results. You need to understand the difference between a healthy workflow and one that's showing signs of trouble. For instance, if tickets consistently spend three days in "Code Review," does that mean your team is meticulous about quality, or is it a bottleneck slowing everyone down?
Recognizing Patterns in Your Time Data
By looking for patterns, you can spot seasonal trends, see how team changes affect your metrics, and tell the difference between normal processing time and troublesome delays. Experienced project managers use these skills to truly understand what's happening in their projects. They become adept at recognizing recurring patterns and anticipating potential roadblocks.
Analyzing Jira time in status data also helps you identify specific areas for improvement. Maybe you can streamline a particular process, offer some extra training to your team, or shift resources around for better efficiency.
Real-World Examples of Time Data Insights
Teams have uncovered some surprising things hidden in their time data. One team noticed a big jump in time spent in the "Testing" phase after a new software release. This led them straight to a bug that was causing delays. Once the bug was fixed, testing time went back to normal. You might be interested in: Jira Workflow Automation.
Another team noticed tickets assigned to one particular developer were consistently spending extra time in "In Progress." They looked into it and realized the developer was having trouble with a specific type of task. This gave them the chance to offer support and help improve the developer's performance.
These examples illustrate the power of actively analyzing Jira time in status data. It’s not enough just to collect the data. You have to actively interpret it to get the most value. This proactive approach to problem-solving is essential for efficient project management. It lets teams address small problems before they become big headaches and impact deadlines.
Creating Reports That Teams Actually Use
Ever wander through a Jira dashboard graveyard, littered with forgotten reports? We’ve all been there. The difference between a report that gathers dust and one that sparks action is simple: it’s about telling a story with the right insights, not just piling on more data.
Designing Dashboards That Tell a Story
Think of dashboards like a conversation. A good one is clear, concise, and relevant. Let's say your dashboard flags a sudden surge in time spent in the "Testing" phase. Instead of just displaying the raw number, imagine it highlighting the affected project and linking directly to the relevant Jira issues. Suddenly, the data isn’t abstract—it’s actionable. Want to dive deeper into custom reports? Check out our guide on custom Jira reports.
Here's another scenario. A dashboard visualizing average time spent in each status, categorized by issue type, reveals "Bug Fixes" consistently lag behind "New Features." This visual narrative immediately points to a process bottleneck ripe for improvement. Visualizing the data this way transforms a dashboard from a static display into a dynamic tool for change.
Visualizing Time Data for Maximum Impact
Visualizations turn raw data into digestible patterns. But just like choosing the right words in a conversation, selecting the right chart is critical. A line graph perfectly illustrates Jira time in status trends over time, revealing ebbs and flows. On the other hand, a bar chart excels at comparing time spent across different statuses, making disparities clear.
Consider your timeframe, too. A weekly view of Jira time in status captures short-term fluctuations, while a monthly view reveals broader trends. The ideal timeframe depends on your reporting goals. And don’t forget about automation! Automating report generation keeps your data fresh without the constant manual grind.
Making Reports Actionable
What good is a report that just sits there? Identifying a bottleneck in "Code Review" is meaningless without action. Maybe you need more reviewers, a tweaked review process, or targeted training. Teams who successfully use Jira time in status reports link these insights to concrete next steps—that’s where the real improvement happens. For example, by early 2025, over 40% of Fortune 500 companies were using Jira Service Management, often due to its integration with tools like Confluence and Loom, which can supercharge team productivity. See Atlassian's blog for more on this.
Essential Time In Status Reports By Role
Different team members need different data. To illustrate this, let's look at how tailored time in status reports can benefit various roles. The following table outlines the key reports, metrics, and update frequencies that different roles typically require for effective workflow management:
Essential Time In Status Reports By Role
Key reports different team roles need for effective workflow management
| Role | Primary Report Type | Key Metrics | Update Frequency |
|---|---|---|---|
| Project Manager | Time in Status Trend Report | Average time in each status, Cycle Time | Weekly/Monthly |
| Development Team Lead | Bottleneck Analysis Report | Time spent in specific statuses (e.g., Code Review, Testing) | Daily/Weekly |
| Service Desk Agent | SLA Compliance Report | Time to Resolution, Time to First Response | Daily/Real-time |
Providing role-specific reports makes them more relevant and encourages regular use, leading to greater workflow efficiency across the board. This targeted approach transforms reports from a chore into a valuable resource for continuous improvement.
Turning Insights Into Faster Workflows
Data without action is like a compass without a map – it points somewhere, but doesn't tell you how to get there. This section explores how to transform Jira time in status insights into actionable improvements, guiding you towards faster workflows and quicker project delivery.
From Data to Action: Real-World Examples
Let's talk about a development team grappling with lengthy code reviews. They used Jira time in status reports and uncovered a surprising pattern: junior developers' code lingered in review much longer than senior developers'. This sparked an idea: a mentorship program pairing junior and senior developers before the formal review. The result? Reviews sped up, code quality improved, and team morale got a boost.
Another team noticed a recurring slowdown in the "Testing" phase, particularly on Fridays. Their time in status data illuminated this Friday bottleneck. It turned out testers were hesitant to start complex tests late in the week, worried about finishing before the weekend. The solution? They simply shifted complex tests earlier in the week during sprint planning. This small adjustment smoothed their workflow and led to more on-time deliveries. Speaking of smooth workflows, have you explored streamlining your creative workflow management?
Practical Strategies for Faster Workflows
Here are some practical strategies for leveraging Jira time in status data to boost your team's efficiency:
-
Reduce Handoff Delays: Analyze the time a task spends between statuses. This can reveal handoff bottlenecks. Consider implementing clearer communication protocols or automated notifications to grease the wheels and speed up transitions.
-
Streamline Reviews: If reviews consistently drag on, take a closer look at the process itself. Do you need more reviewers? Could a structured checklist help? Are there automated tools that could assist?
-
Balance Workloads: Time data can provide a clear picture of your team's capacity. Are some team members consistently overloaded while others have downtime? Adjusting task assignments can create a more balanced workload and improve overall efficiency.
Setting Time-Based Goals and Early Warning Systems
With Jira time in status data, you can set realistic, time-based goals. For instance, aim to complete code reviews within 24 hours. This creates a measurable target and encourages process optimization.
You can also establish early warning systems. If a ticket stagnates in a particular status beyond a defined threshold, an automated alert can notify the right people. This proactive approach prevents small delays from snowballing into major roadblocks. For a deeper dive into resource allocation and project planning, read our article about Jira resource management.
Continuous Improvement and Team Buy-In
Treat your time metrics as a compass for continuous improvement. Regularly review your Jira time in status reports, pinpoint areas for enhancement, and experiment with different solutions. This iterative approach to workflow optimization helps your team constantly refine its processes.
Finally, remember the human element. Securing team buy-in is vital for successful change. Share the data, explain the reasoning behind proposed changes, and involve the team in finding solutions. When everyone understands the why, they're much more likely to embrace the how and contribute to its success.
Connecting Time Data Across Your Tool Ecosystem
Imagine your Jira time in status data as individual puzzle pieces. By themselves, they offer glimpses of activity, but when connected with data from other tools, a complete picture emerges, revealing insights into team performance and business outcomes.
This screenshot of the Atlassian Marketplace reveals a wealth of integrations, showcasing Jira's ability to connect with the other tools your team uses every day. Think of it as a central hub, allowing you to build a tailored workflow that gathers information from various sources.
Integrating Time in Status With Other Tools
Progressive teams leverage APIs (Application Programming Interfaces) and automation to link their systems, creating a unified view of their workflows. This approach reveals hidden connections between Jira data and information from other tools like testing platforms, deployment systems, and business intelligence software.
For example, imagine linking Jira time in status to code quality data from your testing tool. You might discover that longer code reviews in Jira correlate with fewer bugs found during testing, justifying the extra time investment.
Another practical example is integrating Jira with your team's calendars. This can improve resource planning by clearly showing availability, leading to smarter task assignments and fewer bottlenecks caused by unexpected absences. Our Out of Office Assistant is designed to help teams manage absences effectively within Jira.
Correlating Time Data With Key Business Metrics
Connecting Jira's time in status data to business intelligence platforms opens up a new world of insights. Suddenly, you can correlate workflow efficiency with broader business results. Imagine discovering a link between faster issue resolution times in Jira and higher customer satisfaction scores. This direct connection highlights the importance of streamlined Jira processes.
You could also correlate time spent in certain statuses with code quality metrics to understand what truly drives project success. Perhaps shorter "In Progress" times correspond with higher-quality code, suggesting that focused effort yields better results. This type of analysis can lead to impactful process improvements.
Practical Integration Examples
Here are some concrete examples of how integrating Jira time in status with other systems can bring tangible benefits to your team:
-
Calendar Integrations: Enhance resource planning and manage absences more effectively.
-
Testing Tool Integrations: Gain a deeper understanding of development processes by linking status durations to code quality metrics.
-
Business Intelligence Integrations: Connect workflow data to key business results like customer satisfaction or revenue.
-
Deployment System Integrations: Identify and address deployment bottlenecks by tracking the time it takes to move from "Code Complete" to "Deployed."
By combining Jira's time in status data with information from your entire tool ecosystem, you gain a more comprehensive view of your workflow and its impact on your business. This holistic perspective empowers data-driven decisions and continuous process improvement.
Your Implementation Roadmap For Success
Ready to give your workflow management a boost? This roadmap offers a clear, step-by-step plan for implementing effective Jira time in status tracking and optimizing your processes. We'll explore immediate actions for quick wins, medium-term goals for robust reporting, and long-term strategies for continuous improvement. Think of it like building a house: we'll start with the foundation, then frame the walls, and finally add the finishing touches. Each phase includes practical checklists, benchmarks for progress, and solutions to common challenges. You'll discover specific metrics to track success, techniques for getting your team on board, and strategies for keeping the momentum going. This guide is built on real-world success stories from teams who have mastered Jira time in status data.
Phase 1: Getting Started – Quick Wins Today
This initial phase focuses on setting up basic Jira time in status tracking and gaining those valuable first insights. It's like taking a quick inventory of your current workflow.
- Identify Key Statuses: Don't try to track everything at once. Instead, zero in on the most important statuses in your workflow. Start small, perhaps with "To Do," "In Progress," and "Done."
- Configure Jira: Make sure Jira is correctly set up to record timestamps for the statuses you selected. Double-check your working hours and holiday settings for accurate time calculations. This is the foundation for reliable data.
- Generate Initial Reports: Run some basic Jira time in status reports to get a baseline understanding of your current workflow. Concentrate on the average time spent in each key status. This baseline will become your benchmark for progress.
- Communicate with Your Team: Clearly explain to your team why you're tracking time in status. Emphasize that it's about improving the workflow, not monitoring individual performance. Open communication is key to team buy-in.
Phase 2: Building Momentum – Robust Reporting (Medium-Term)
Once you've got a handle on the basics of Jira time in status, you can build more detailed reports and dashboards. You might find this interesting too: Read also: Jira Capacity Planning. This phase is like adding walls and rooms to your house – creating structure for better analysis.
- Explore Advanced Reporting Features: Delve into Jira's advanced reporting features, like filters and custom fields, to craft reports that truly give you insights. Think of these features as your reporting toolbox, allowing you to tailor reports to specific project needs.
- Visualize Your Data: Transform your Jira time in status data into visuals using charts and graphs. A picture is worth a thousand words, and visualizing your data will reveal trends and bottlenecks much more effectively than staring at rows of numbers. Carefully choose the right chart type – bar charts for comparisons, line graphs for trends over time.
- Share Reports with Stakeholders: Regularly share your findings with your team and other stakeholders. This fosters transparency and opens the door to discussions about workflow improvements.
Phase 3: Continuous Improvement – Optimization (Long-Term)
This phase is about using your Jira time in status data for ongoing optimization – adding those finishing touches to your house.
- Establish Key Metrics: Pinpoint the specific metrics you'll track to measure workflow improvement. This might include cycle time, average time in each status, or the number of issues completed per sprint. These metrics will be your compass, guiding you toward efficiency.
- Regularly Review and Analyze: Develop a habit of regularly reviewing your reports and analyzing trends. Think of this as regular health checkups for your workflow, helping you identify areas for improvement and track the effectiveness of any changes you make.
- Automate Reporting: Save time and ensure access to the latest data by automating report generation.
- Integrate with Other Tools: Consider connecting your Jira time in status data with other tools your team uses, such as calendars or testing platforms. This provides a more holistic view of your workflow, connecting the dots between different aspects of your work.
By following this roadmap and consistently analyzing your data, you can transform your workflow, improve team performance, and achieve greater project success. Streamline your team's workflow and improve productivity with our Out of Office Assistant for Jira Cloud. It automates handovers and maintains uninterrupted workflows during team absences, allowing for guilt-free breaks and faster delivery.
