
Why Your Customer Service Metrics Dashboard Isn’t Working
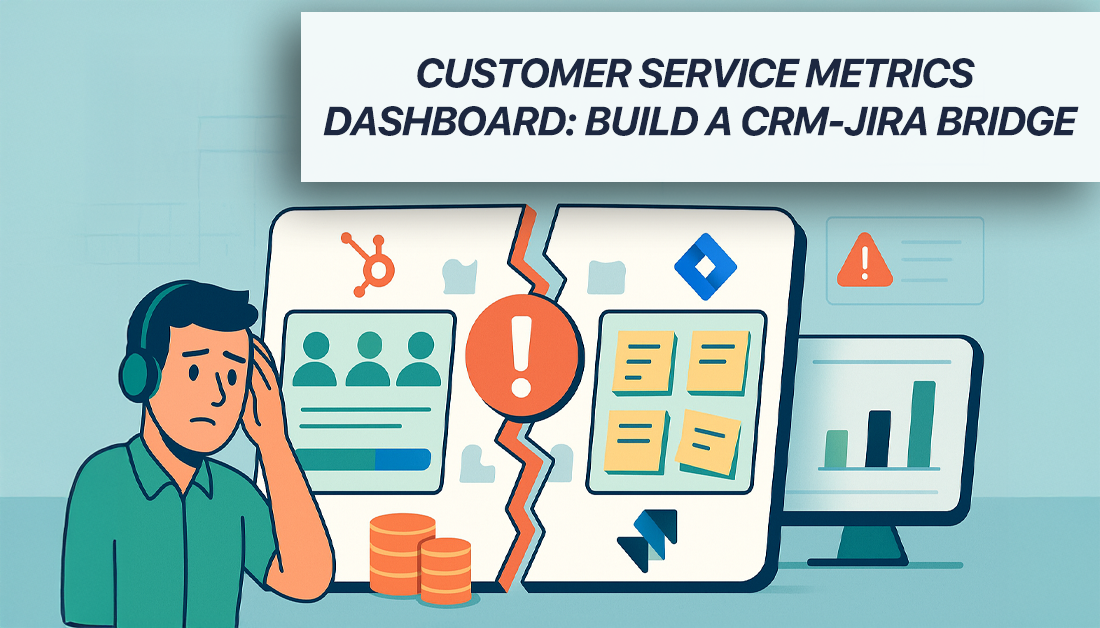
Let’s face it: your current customer service metrics dashboard probably isn’t giving you the full picture. You might be collecting plenty of data from tools like HubSpot and Jira, but are you actually getting actionable insights? Many teams struggle to connect the dots between customer data and issue tracking, leading to frustration and wasted effort.
This disconnect often arises from using separate platforms for customer relationship management (CRM) and issue tracking. When your customer data lives in HubSpot while issue tracking happens in Jira, traditional dashboards can’t bridge the gap. This fragmentation creates significant blind spots, making it difficult to pinpoint areas for improvement and hindering your team’s overall effectiveness.
Are You Tracking the Right Metrics?
One common pitfall is focusing on the wrong metrics. For example, prioritizing average handle time (AHT) might seem logical, but it can incentivize agents to rush interactions. This can negatively impact customer satisfaction, ultimately undermining the core purpose of your customer service team. Focusing solely on speed can sacrifice quality.
Connecting the Dots in the Customer Journey
Modern customer journeys are complex. Customers interact with businesses across various channels, and their issues often require collaboration between multiple teams. A truly effective customer service metrics dashboard must connect these touchpoints to provide a holistic view of the customer experience. Without this interconnectedness, your team loses valuable context.
The Importance of Actionable Insights
The rising importance of customer experience (CX) is reflected in the increasing adoption of customer service dashboards. By 2025, 81% of organizations will consider CX a key differentiator, and 86% of buyers will be willing to pay more for exceptional service. You can find more insights about the future of customer service dashboards here: Best Customer Service Dashboards 2025.
Simply collecting data isn’t enough. Your dashboard needs to translate raw data into actionable insights that empower your team to make real improvements. This requires bridging the gap between HubSpot and Jira, a capability often lacking in traditional dashboards. Without this crucial link, understanding the relationship between customer issues and business outcomes becomes nearly impossible.
A disconnected customer service metrics dashboard ultimately leads to wasted time, frustrated employees, and dissatisfied customers. So, what’s the true cost of these data silos, and how can you effectively connect HubSpot and Jira to gain a comprehensive understanding of your customer service performance?
The Real Cost of Data Silos in Support Operations

Your customer service metrics dashboard should be the central hub for understanding your team’s performance. But what happens when your customer data in HubSpot and issue tracking in Jira don’t communicate? Instead of clarity, you get confusion. This disconnect has tangible consequences.
Support agents waste precious time switching between systems, searching for customer information. This leads to longer resolution times and unhappy customers. Revenue teams struggle to grasp the impact of product bugs on important accounts, potentially leading to preventable churn and lost revenue.
Without a unified view, product managers miss critical feedback patterns. Making informed decisions about product development becomes a significant challenge. The overall impact of these disconnected systems can ripple throughout the organization.
The Impact on Your Team
Imagine a customer contacts support with a complicated technical problem. The agent has to jump between HubSpot for customer details and Jira for the issue history. The customer is forced to repeat their issue, adding to their frustration. Learn more about how to improve data validation.
This fragmented process isn’t just bad for customer relationships; it also increases agent frustration. This inefficiency goes beyond individual interactions. It contributes to lower team morale and reduced productivity across the entire support team.
The Financial Implications
The costs associated with data silos extend beyond frustrated customers and overworked agents. Fragmented data obscures the root causes of customer issues. Your team may end up treating symptoms instead of addressing the underlying problems. This leads to recurring issues and wasted resources, ultimately impacting your bottom line.
Furthermore, the lack of accurate insights hinders leadership teams from making data-driven decisions. Resource allocation and product development become guesswork instead of strategic choices. Accurate data is essential for making informed decisions and driving business growth.
Customer satisfaction (CSAT) scores are a vital metric in customer service dashboards. The global average CSAT score typically falls between 75% and 85%, reflecting customer happiness and loyalty. Find out more about customer service statistics. When your data is fragmented, accurately measuring and improving this crucial metric becomes a significant hurdle.
A disconnected customer service metrics dashboard is more than just inefficient; it actively hinders your team. It prevents them from providing excellent customer experiences. This creates a ripple effect across your entire organization, impacting everything from agent morale to revenue growth. Connecting HubSpot and Jira transforms your dashboard into a powerful tool, empowering your team and strengthening customer relationships. A unified view is essential for success.
How HubSpot for Jira Transforms Dashboard Visibility
A truly effective customer service metrics dashboard doesn’t just present data; it tells a compelling story. It connects customer interactions within HubSpot with the resolution of issues in Jira, providing a unified view of the entire customer journey. The HubSpot for Jira app bridges this divide, automatically synchronizing vital information in real time, giving you the actionable insights you need to enhance your support operations. For a deeper dive into aligning your teams with this powerful integration, check out our guide: How to master HubSpot and Jira integration for aligning teams.
The infographic below visualizes the core process of a customer service metrics dashboard: collecting data from incoming tickets, calculating key metrics (such as CSAT and average response time), and visualizing them on a dashboard.
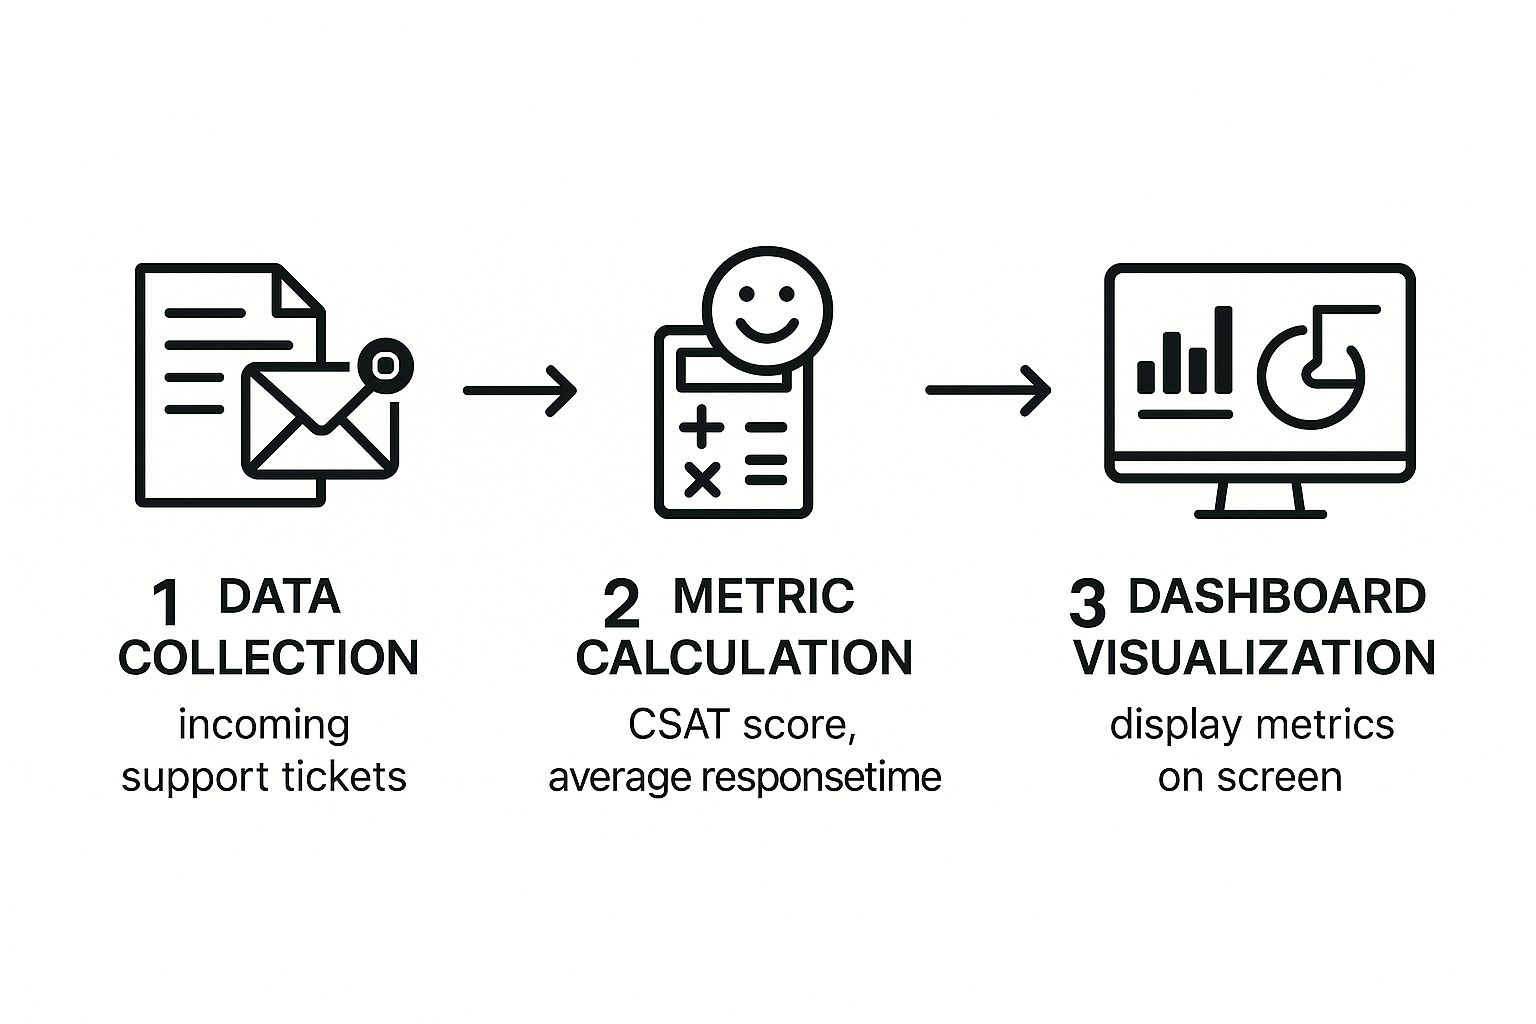
This straightforward flow underscores the importance of data collection and calculation for effective visualization and subsequent action. By directly connecting data collection to visualization, teams can quickly respond to the metrics displayed and implement necessary changes.
Two-Way Synchronization: Keeping Your Data Consistent
Imagine updating information in HubSpot and seeing it instantly reflected in Jira. This is the power of two-way field synchronization. With HubSpot for Jira, your customer service metrics dashboard remains consistently up-to-date, eliminating manual data entry and reducing the risk of errors. This ensures that everyone, from support agents to managers, is working with the same accurate, real-time information.
Automated Ticket Creation: Streamlining Your Workflow
Eliminate the tedious process of copying and pasting information between systems. HubSpot for Jira enables automatic ticket creation directly from HubSpot contacts. This streamlines your workflow, freeing up your team to focus on solving customer issues rather than managing administrative tasks. This automation also minimizes errors and boosts overall efficiency.
Instant Customer Context: Empowering Your Support Team
With embedded contact and company panels directly within Jira, your agents have all the essential customer information readily available. No more searching through multiple systems to understand customer history or past interactions. This empowers your team to deliver personalized and highly effective support experiences.
Real-Time Comment Mirroring: Fostering Transparency
Clear communication is essential for effective customer support. With real-time comment mirroring, any updates or notes made in HubSpot are instantly visible in Jira, and vice versa. This promotes transparency and ensures that everyone, including the customer, is informed about the latest developments. This seamless communication flow encourages collaboration and improves resolution times.
Configuring Your Integration: A Simple Setup Process
Setting up the HubSpot for Jira integration to enhance your customer service metrics dashboard is surprisingly simple. Here’s a quick overview:
- Install from the Atlassian Marketplace: Locate the HubSpot for Jira app and install it in your Jira instance.
- Link Your Accounts: Securely connect your HubSpot and Jira accounts within the app’s settings.
- Map Your Fields: Select which fields to synchronize between the two platforms, ensuring your dashboard receives the most pertinent data.
- Configure Permissions: Control data access to protect sensitive information.
- Test Your Integration: Verify that data flows correctly and your dashboard displays accurate metrics.
- Refine and Optimize: Continuously monitor and adjust your field mappings and workflows to adapt to your evolving business needs.
To help illustrate the benefits of this integration, let’s examine a feature comparison:
To understand the impact of this integration on your reporting capabilities, let’s look at a comparison of key features:
HubSpot for Jira Integration Features Comparison
| Feature | Without Integration | With HubSpot for Jira | Dashboard Impact |
|---|---|---|---|
| Customer Data Visibility | Limited to HubSpot | Available within Jira | Provides context for support agents, leading to faster resolution times and improved customer satisfaction. |
| Ticket Creation | Manual | Automated | Reduces manual effort, minimizes errors, and improves team efficiency. |
| Data Synchronization | None | Two-way, real-time | Ensures data consistency and accuracy across platforms, enabling more reliable reporting. |
| Communication | Siloed | Real-time comment mirroring | Improves transparency and keeps everyone informed, fostering collaboration and faster issue resolution. |
This table highlights how the HubSpot for Jira integration streamlines workflows, improves data accuracy, and enhances communication, ultimately leading to a more powerful and insightful customer service metrics dashboard.
By following these straightforward steps, you can transform your customer service metrics dashboard into a powerful tool for continuous improvement. Interested in learning more about data-driven customer service dashboards? Check out this resource: How to integrate a data-driven customer service dashboard. This integration empowers you to make informed, data-driven decisions, improve team efficiency, and deliver exceptional customer experiences.
Success Story: From Chaos to Clarity in 90 Days

Meet Sarah, a customer success manager at a fast-growing SaaS company. She was overwhelmed, spending countless hours manually creating reports for her customer service metrics dashboard. Her team struggled to connect technical issues in Jira with high-value customer accounts in HubSpot. Product managers, lacking data, were making decisions without a clear picture. This lack of visibility was impacting customer satisfaction and team morale. Does this sound like a familiar scenario?
Then, Sarah’s team implemented the HubSpot for Jira integration. They immediately saw improvements. Enhance your dashboard visibility by integrating live chat data using tools like the integration for Jira Service Desk Live Chat. Within a month, their average resolution time decreased by 40%. Agents had instant access to customer information within Jira, empowering them to resolve issues quickly.
Identifying Key Pain Points and Driving Targeted Improvements
The unified customer service metrics dashboard revealed a crucial insight: 60% of enterprise customer issues came from just three product features. This allowed the product team to prioritize improvements in the areas with the biggest impact on customer satisfaction. These targeted fixes boosted satisfaction scores, leading to happier customers and a more effective support team.
This demonstrates how connecting your data can uncover hidden patterns and drive change. Integrating customer service metrics into unified dashboards allows companies to improve workflows and agent productivity. Learn more about crucial customer service metrics here: Key Customer Service Metrics.
From Spreadsheets to Strategy: Reclaiming Valuable Time
The most significant change was the impact on Sarah’s workload. Instead of working with spreadsheets, she could focus on strategic initiatives. She now spends her time analyzing data, coaching her team, and proactively addressing customer needs. This shift from manual reporting to strategic analysis is a key advantage of a well-integrated customer service metrics dashboard.
Measuring the ROI: Reduced Churn and Increased Satisfaction
The results were clear. In the first quarter after implementing HubSpot for Jira, customer churn decreased by 23%. The support team’s job satisfaction also reached an all-time high. These outcomes demonstrate the strong return on investment that a unified customer service metrics dashboard can offer. By connecting HubSpot and Jira, Sarah’s team transformed their operations, moving from chaos to clarity in just 90 days. This success story showcases the benefits of integrating your CRM and issue tracking systems to improve customer service performance.
Dashboard Design That Actually Gets Used
Building a customer service metrics dashboard is only half the battle. The real challenge? Creating a dashboard your team actually uses. A poorly designed dashboard gathers digital dust while your team reverts to inefficient manual processes, defeating its very purpose.
So, how do you design a customer service metrics dashboard that becomes indispensable? It’s about understanding user needs, prioritizing key metrics, and presenting information clearly and actionably. This means moving beyond simply displaying data and empowering your team to improve customer service.
Role-Based Views: Empowering Individual Team Members
One-size-fits-all dashboards rarely work. Front-line agents need different information than managers. Agents require real-time access to customer context and ticket status. Managers, on the other hand, focus on trend analysis and performance benchmarks. Role-based views provide each team member with quick access to the most relevant data, increasing efficiency and improving individual performance.
Actionable Alerts: Focusing on What Truly Matters
Automated alerts can be powerful, but too many lead to notification fatigue. The solution? Limit alerts to truly actionable situations. An alert for a significant drop in CSAT for a specific product feature is far more valuable than a notification for every minor fluctuation. This targeted approach ensures alerts are treated as important signals, not ignored noise.
Meaningful Benchmarks: Using Your Own Data for Context
Industry averages offer a general benchmark, but meaningful performance targets require using your own historical data. This provides context specific to your business and tracks progress relative to your past performance. This internal focus fosters continuous growth and avoids potentially irrelevant external comparisons.
Regular Reporting Cadences: Driving Continuous Improvement
A regular reporting cadence is vital for ongoing improvement. However, excessive analysis can be overwhelming. Finding a balance that promotes consistent monitoring without overburdening your team is key. Regular reviews help identify trends, highlight areas for improvement, and ensure your customer service metrics dashboard remains a valuable tool. You might be interested in: How to master Jira dashboard examples.
Telling the Story: Connecting Actions to Outcomes
Perhaps the most crucial element of a successful dashboard is its ability to tell a story. It should clearly connect individual actions to business outcomes. When team members see how their work contributes to positive results, they become more invested in using the dashboard. This fosters a sense of ownership and makes everyone feel like their contributions matter.
By focusing on these design principles, you can transform your customer service metrics dashboard from static data into a dynamic tool. It empowers your team, drives continuous improvement, and leads to happier customers and a healthier bottom line. A well-designed dashboard tells a compelling story, engaging your team and motivating them to deliver exceptional customer service.

Getting Started: Your 30-Day Implementation Roadmap
Ready to transform your customer service metrics dashboard from a pain point to a powerful asset? This 30-day roadmap offers a practical, step-by-step guide to successful implementation. We’ll break down the process into manageable weekly phases, from initial technical setup to team adoption and ongoing refinement.
Week 1: Laying the Foundation
This first week focuses on the essential technical components. Start by installing the HubSpot for Jira app directly from the Atlassian Marketplace. It’s a straightforward process that connects your CRM and issue tracking systems.
Next, configure the basic field mappings between HubSpot and Jira. This ensures the right data flows into your customer service metrics dashboard, providing accurate insights. Finally, establish your integration permissions to control data access and maintain security.
Week 2: Designing Your Data Flow
With the technical setup complete, week two is all about optimizing your data flow. Identify the key HubSpot properties and Jira fields crucial for tracking your specific metrics. These might include customer demographics, product usage data, or issue types.
Then, set up automated workflows for ticket creation. This automation eliminates manual data entry and streamlines your support processes, boosting team efficiency. Lastly, thoroughly test your synchronization settings to ensure seamless data flow between HubSpot and Jira, keeping your dashboard updated in real time.
Week 3: Building Your Dashboard
In week three, you’ll bring your data to life visually. Begin by building role-specific dashboard views. Tailor these views to the needs of different team members. Support agents, for example, benefit from real-time customer context and ticket status, while managers need a broader overview of trends and performance benchmarks.
Next, establish those performance benchmarks. Use your historical data to set realistic goals and track your progress. Finally, create automated reports for different stakeholders, ensuring everyone stays informed and aligned with your customer service objectives.
Week 4: Driving Adoption and Refinement
The final week concentrates on team onboarding and continuous improvement. Begin by training your team on the new processes and dashboard features, empowering them to use the tool effectively.
Gather feedback on the dashboard’s usefulness and be open to making adjustments. This collaborative approach encourages buy-in and ensures the dashboard meets your team’s needs. Finally, refine your chosen metrics based on actual usage patterns. Continuously adapt and adjust your dashboard to maximize its effectiveness and drive ongoing improvement.
To help guide you through the setup process, use the checklist below:
Introducing the “Customer Service Metrics Dashboard Setup Checklist.” This table provides a step-by-step guide for implementing your dashboard with HubSpot and Jira integration.
| Phase | Tasks | Timeline | Success Criteria |
|---|---|---|---|
| Week 1: Foundation | Install HubSpot for Jira app, Configure field mappings, Set up permissions | Week 1 | Successful connection between HubSpot and Jira, Secure data access |
| Week 2: Data Flow | Identify key properties and fields, Automate ticket creation, Test synchronization | Week 2 | Automated data flow between systems, Accurate real-time data in HubSpot |
| Week 3: Dashboard Build | Create role-specific views, Establish benchmarks, Create automated reports | Week 3 | Functional dashboard displaying key metrics, Reports generated |
| Week 4: Adoption & Refinement | Team training, Gather feedback, Refine metrics | Week 4 | Team proficient in dashboard use, Metrics aligned with business goals |
This checklist helps ensure a smooth and efficient implementation process. By following these steps, you can effectively track your customer service performance and identify areas for improvement.
Remember, a phased approach is key. Start small, perhaps with a pilot group. Demonstrate value quickly, then scale the implementation across your organization. This measured rollout helps refine processes and address any challenges before a full launch. Ready to connect your CRM and issue tracking systems? Try HubSpot for Jira free today and transform your customer service operations.
