

Why Your Current Jira Reports Are Failing You
Let’s face it: you’ve likely spent countless hours deciphering Jira’s default reports, only to find they don’t provide the answers you need. These standard reports often lack the detailed insights required for truly effective project management. This can be incredibly frustrating, leaving you constantly searching for more meaningful data.
For instance, imagine needing to understand how bugs are distributed across different software components. A standard Jira report might tell you the total number of bugs, but it won’t necessarily break them down by component. This lack of detail makes it difficult to identify problem areas and effectively allocate resources.
The Limitations of Out-of-the-Box Reporting
One of the main issues with default reports is their rigidity. They’re designed for broad use cases and often miss the specific needs of individual projects. Furthermore, they often lack the ability to integrate custom fields, which are essential for capturing project-specific information. This means critical data relevant to your team’s workflow could be completely missing from your reports.
However, Jira’s reporting foundation does have its strengths. Jira reports, including custom options, are a mainstay for teams using Jira as their project management tool. These reports offer a useful and cost-effective way to streamline data management and gain insights for better business outcomes. By combining Jira’s built-in reporting features with custom solutions, teams can potentially boost efficiency and collaboration by up to 30%. This highlights the importance of using Jira’s capabilities while acknowledging the need for customization to fully realize its potential.
Recognizing the Warning Signs
Several red flags indicate your current reporting setup is hindering your project’s progress. Are you constantly exporting data to spreadsheets for additional analysis? Do your reports fail to offer actionable information? Are your stakeholders struggling to grasp the data presented? These are all signs you need to consider Jira custom reports.
Transitioning to customized reports lets you tailor the presented information to your specific requirements, ultimately leading to more informed decisions and better project outcomes. This shift empowers you to go beyond general overviews and focus on the data that truly drives success.
Finding The Right Tools For Advanced Jira Reporting
Choosing the right tools for Jira custom reports can significantly impact your team’s efficiency and decision-making. Selecting the wrong platform can lead to wasted time and frustration. This guide will help you evaluate and select the best reporting tools for your specific needs.
Key Features to Consider
Not all reporting tools are created equal. When evaluating different options, keep these essential features in mind:
-
Seamless Integration: The tool should integrate smoothly with your existing Jira setup, minimizing workflow disruptions. Tools like ManageEngine Analytics Plus and eazyBI are known for their seamless integration capabilities.
-
Customization Options: The ability to create truly custom reports is crucial. Look for tools that let you tailor reports to your specific needs, including custom fields and calculations.
-
Data Visualization: Effective data visualization is key to understanding complex data. The tool should offer a variety of chart types and customization options for clear and compelling data presentation.
-
Automation Capabilities: Automating report generation and distribution saves time and ensures your team always has access to the latest data.
The use of custom reports in Jira has grown significantly, particularly with platforms like ManageEngine Analytics Plus. This platform offers over 100 pre-built reports and dashboards, enabling comprehensive project data analysis with minimal setup. Teams can save up to 50% of the time spent on data analysis and report creation by leveraging such tools. Learn more about the benefits of these platforms: ManageEngine Analytics Plus Benefits. For further information on Jira automation, see this helpful resource: Jira Automation Rules.
Evaluating Reporting Platforms
The infographic below illustrates the benefits of using Jira custom reports. It compares the average time saved per project, the number of weekly actionable insights, and the report adoption rate across teams.
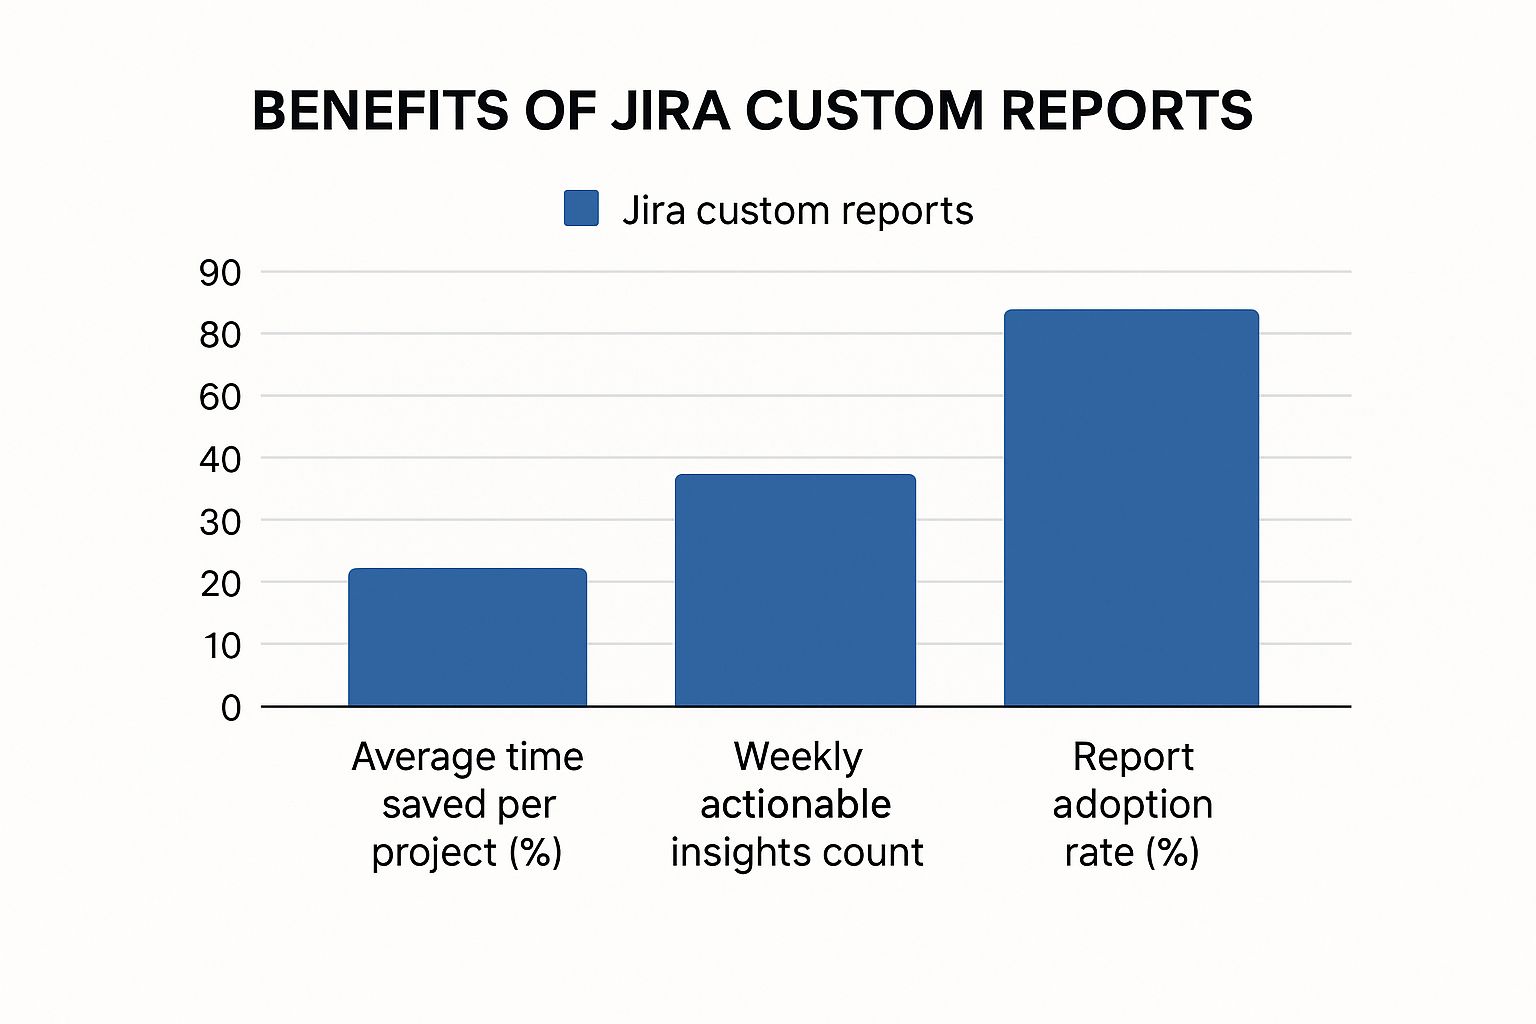
As the infographic shows, custom reports lead to significant time savings, more actionable insights, and higher adoption rates across teams. Choosing the right tools is essential to unlock these advantages.
To help you compare different options, we’ve compiled a table summarizing the features of some popular Jira reporting tools:
Jira Reporting Tools Comparison
Compare features, pricing, and capabilities of top Jira reporting platforms
| Tool Name | Key Features | Best For | Pricing Model | Setup Complexity |
|---|---|---|---|---|
| ManageEngine Analytics Plus | 100+ pre-built reports, seamless Jira integration, automated reporting | Large teams, complex projects | Subscription | Low |
| eazyBI | Customizable reports, advanced data visualization, integration with other platforms | Data-driven teams, custom reporting needs | Subscription | Medium |
| Power BI Connector for Jira | Integration with Power BI, extensive visualization options, data transformation capabilities | Businesses already using Power BI | Connector is free, Power BI requires license | Medium to High |
| Jira Cloud native reporting | Basic reporting functionality, built-in dashboards, simple metrics | Small teams, basic reporting needs | Included with Jira Cloud | Low |
This table highlights key differences and similarities between popular Jira reporting tools, enabling you to make a more informed decision based on your specific needs. Key takeaways include considering pre-built reports for quick insights, customization options for tailored reports, and integration capabilities for streamlined workflows.
Matching Tools to Your Needs
Different teams have different reporting needs. Consider these factors when making your selection:
-
Team Size: Smaller teams might benefit from simpler tools, while larger teams might require more robust platforms with advanced features.
-
Project Complexity: Complex projects often need more sophisticated reporting to track multiple variables and dependencies.
-
Technical Constraints: Consider your team’s technical expertise and choose a tool that aligns with their skills and available resources.
-
Budget: Reporting tools range from free add-ons to enterprise-level platforms. Select a solution that fits your budget.
By carefully evaluating these factors, you can choose a Jira reporting tool that empowers your team to make data-driven decisions and achieve project success.
Creating Reports That Actually Drive Decisions
Creating effective Jira custom reports isn’t about dazzling visuals. It’s about transforming data into a story that motivates action. The real difference between a decent report and one that drives decisions lies in its ability to resonate with stakeholders and inspire them to take meaningful steps. Let’s explore how to create reports that truly make a difference.
Identifying Key Metrics and Audience Needs
Reporting isn’t a one-size-fits-all solution. Savvy project managers tailor their Jira custom reports to the specific needs of their audience. Understanding what metrics matter most is crucial.
Executives, for instance, might prioritize overall project ROI. Development teams, on the other hand, might focus on bug resolution rates. By tailoring your reports, you ensure relevance and encourage engagement.
Also, consider how your audience prefers to consume information. Some may appreciate concise summaries, while others prefer granular detail. Offering different levels of detail – perhaps high-level dashboards for executives and more in-depth reports for team leads – caters to these varying preferences and encourages broader report usage.
Transforming Data into Compelling Narratives
Presenting the right metrics is only half the battle. The next step is presenting them in a way that tells a compelling story. Think of your report as a narrative with a beginning, middle, and end.
Start by setting the context. Then, present your data findings. Finally, offer actionable conclusions. For example, if your report focuses on sprint velocity, don’t just show the numbers. Explain what those numbers mean. Did velocity increase or decrease? Which factors contributed to the change? What actions can the team take to improve future sprints? This narrative approach transforms raw data into useful insights.
Customizing Jira reports empowers project managers to extract targeted data and present it clearly. This can lead to better trend identification, uncover hidden inefficiencies, and promote evidence-based decision-making. Teams can improve their decision-making processes by up to 25% and boost their ability to meet project goals by as much as 15%. For more information on these statistics, check out the Jira Adoption Dashboard. You can also learn more about data-driven decision-making through resources like this article on How to master data-driven decision making.
Leveraging JQL and Dashboard Design
Jira’s JQL (Jira Query Language) provides powerful tools for precise data extraction. Leverage advanced JQL techniques to filter data by custom fields, time periods, and other criteria, ensuring your reports contain exactly the information you need. When considering tools for advanced Jira reporting, it’s helpful to look at how other industries use digital tools. For example, check out these tools every dentist needs for digital marketing success.
Effective dashboard design is also key for readability and engagement. Organize widgets logically, use clear labels, and select visualizations that clearly represent the data. Interactive elements, like drill-down functionality, allow users to explore data in greater detail. These design principles transform complex data sets into digestible, user-friendly insights.
Mastering JQL For Powerful Data Extraction
The real strength of Jira data lies beyond simple searches. It resides in the power of JQL (Jira Query Language). Yet, many teams use only a small portion of its capabilities. This section explores advanced JQL techniques, helping you uncover hidden insights within your project data. Creating impactful, decision-driving reports often requires understanding key metrics and applying conversion optimization fundamentals.
Constructing Sophisticated Queries
JQL lets you build complex queries that go far beyond basic keyword matching. You can create queries that span multiple projects, filter by custom fields with laser precision, and extract time-based metrics to reveal important trends.
For example, imagine pinpointing all bugs reported last month within a specific project. Further refine this by bugs assigned to a specific team member with a certain priority level. This level of detail enables focused analysis and data-driven decision-making.
Filtering by Custom Fields With Precision
Custom fields are essential for capturing project-specific information. JQL helps you use this data effectively in your Jira custom reports. Suppose you have a custom field called “Feature Complexity.” JQL allows you to filter issues based on this field, revealing all high-complexity features currently in progress. This focused view can help you prioritize resources and proactively manage risks.
JQL also provides a robust set of operators and functions for manipulating and analyzing data. You can use functions like DATEADD() to calculate deadlines or RANK() to prioritize issues based on specific criteria. This versatility transforms Jira into a powerful data analysis platform, allowing you to extract the exact information you need.
Optimizing JQL Queries for Performance
As your projects grow, so does your data. Optimizing your JQL queries becomes essential for maintaining fast report loading times. Using the right operators, like IN instead of multiple OR conditions, can dramatically improve performance. Avoiding wildcard characters at the beginning of search strings also allows Jira to find results more efficiently.
Through practical examples and exercises, you can build the expertise to create dynamic JQL queries that adapt as your project evolves. Mastering JQL elevates you from a casual Jira user to a power user, extracting the precise data your team needs. This empowers you to make informed decisions, optimize workflows, and ultimately drive project success.
Building Dashboards That Teams Actually Use
A useless dashboard is a dashboard nobody uses. The aim is to build interactive Jira custom reports and dashboards that become essential tools for your team and stakeholders. This involves finding the right mix of comprehensive data and user-friendliness. The goal is to display the right data in a clear, actionable way.
Organizing Widgets for Intuitive Navigation
Imagine your dashboard as a shop window. You want to naturally draw users to the most vital information. Display key metrics prominently, using visually engaging widgets to grab attention. For example, a large Sprint Burndown chart can immediately show sprint progress, allowing teams to quickly understand the current status without digging through detailed reports.
Group related widgets together into logical sections. This could be categorized by project, team, or metric type. Like a well-organized shop, a well-structured dashboard helps users quickly find what they need. This encourages regular use, making the dashboard a central hub for project data.
Implementing Drill-Down Capabilities and Role-Based Views
Drill-down functionality allows users to explore data more deeply. Clicking on a chart element could reveal a detailed breakdown of the underlying data. It’s like an interactive map – users can start with a bird’s-eye view and then zoom in for details. This fosters deeper data analysis and more informed decisions. You might be interested in: Jira Dashboard Examples.
Role-based views tailor the information displayed, so different audiences see only relevant data. A project manager might require a comprehensive task overview, while a stakeholder may only need a high-level progress summary. This streamlines data interpretation and avoids information overload.
Integrating Data Sources and Automating Refresh Schedules
Modern dashboards often pull data from multiple sources. Integrate external sources like CRM systems or marketing platforms to create a holistic view of project performance. Imagine seeing sales data alongside development progress – this can uncover important insights into the impact of new features.
Automated refresh schedules ensure data is always current. This eliminates manual updates and provides real-time insights, facilitating quicker reactions to changing project conditions, proactive management, and improved results. Responsive layouts that adapt to different screen sizes ensure seamless access across devices, so everyone can access the information they need.
Choosing the Right Widgets for Your Needs
Choosing appropriate widgets for your Jira custom reports is vital for dashboard effectiveness. The table below details different widget types, their uses, and ideal stakeholder levels. To give you a clearer picture of how these widgets can be employed, let’s take a look at the table below. This table provides an overview of various widget types, the data they display, how they are best used, which stakeholder level benefits most, and how often the data should be refreshed.
Dashboard Widget Types and Use Cases
| Widget Type | Data Displayed | Best Use Case | Stakeholder Level | Update Frequency |
|---|---|---|---|---|
| Sprint Burndown | Remaining work in a sprint | Tracking sprint progress | Team, Project Manager | Daily |
| Velocity Chart | Sprint velocity over time | Measuring team performance | Team Lead, Product Owner | Per Sprint |
| Issue Statistics | Number of issues by status, type, etc. | Identifying bottlenecks | Team, Project Manager | Daily |
| Cumulative Flow Diagram | Work in progress across statuses | Visualizing workflow efficiency | Team, Project Manager | Weekly |
| Gadget for Out of Office Assistant | Team member availability | Resource planning and task assignment | Team Lead, Project Manager | Real-time |
This table highlights the various widgets available and how they can be utilized for different purposes by different team members. By choosing the right widget and refresh frequency, each stakeholder can gain the specific insights they need.
By combining the right widgets, organizing them effectively, and implementing drill-down functionality, you can build powerful dashboards that drive data-driven decisions and contribute to overall project success. Remember: the ultimate goal is to translate data into actionable insights that empower teams to perform at their peak.
Automating Reports To Save Your Sanity

Tired of manually updating Jira reports? Reclaim your valuable time with intelligent automation. This approach keeps your team informed with the latest data while freeing you from tedious, repetitive tasks. The result? More time for strategic work and less time spent on manual updates.
Scheduling Reports and Automating Distribution
Imagine reports that update themselves. With automation, this isn’t a fantasy. Scheduled reports refresh automatically with the latest data, eliminating manual intervention.
For example, schedule a daily report to run each morning before your team arrives. This gives them a fresh overview of project progress right from the start.
Automate report distribution as well. Use email lists to deliver reports to the right stakeholders at the optimal time. This keeps everyone informed without overwhelming inboxes. Learn more about this in our article on reporting automation tools.
Setting Up Smart Alerts and Maintaining Data Security
Automation offers more than just scheduling. Smart alerts notify stakeholders only when critical events occur. This focuses attention where it’s needed, preventing alert fatigue.
For instance, an alert could trigger if a high-priority bug remains unresolved for a specific time, prompting immediate action.
But automation shouldn’t compromise security. Automated workflows can be configured to preserve data integrity and control access. This enables broad information sharing while safeguarding sensitive project data.
Streamlining Workflows with Templates and Approvals
Report templates save time and ensure consistency. These templates can adapt to changing project needs, providing a standardized reporting framework. This is especially helpful for recurring reports like weekly status updates or monthly performance reviews. Update the data easily while maintaining the report’s structure and format.
Sensitive information might need approval before distribution. Automated workflows can incorporate these approvals, ensuring data security and compliance. This adds a necessary layer of control while still enabling access to essential information. By combining automation with strong security and streamlined approvals, you ensure accurate, timely, and secure access to the data that drives your projects forward.
Measuring What Actually Matters For Project Success
Not all metrics are created equal. Some offer valuable insights into project performance and drive improvement, while others, known as vanity metrics, simply look impressive without providing actionable information. Focus your Jira custom reports on the KPIs that truly matter – those that directly influence project outcomes and align with your overall business objectives.
Identifying Valuable Metrics
Which metrics are most valuable depends on various factors such as the project type, team structure, and organizational goals. For software development, metrics like sprint velocity, bug resolution rate, and code quality are often crucial. A marketing campaign, however, might prioritize metrics like website traffic, conversion rates, and lead generation. Gain valuable insights into resource allocation and project forecasting with this guide on Jira Capacity Planning.
Aligning these metrics with overarching business goals is essential. If your organization aims to increase market share, your project metrics should reflect your project’s contribution to that objective, ensuring your reporting directly supports the company’s strategic direction.
Establishing Baselines and Setting Targets
After identifying key metrics, establish realistic baselines to serve as a starting point for measuring progress. For example, if your baseline bug resolution rate is 75%, set an attainable target, like 85%, within the next quarter. This approach allows for meaningful progress tracking and demonstrates the effectiveness of your project management efforts.
Trending reports, showcasing progress over time, provide valuable context. These reports reveal how project performance evolves, pinpointing areas needing improvement and showcasing your team’s accomplishments. This data becomes a powerful tool for strategic decision-making.
Communicating Project Value to Stakeholders
Effectively communicating your project’s value to executive stakeholders often involves translating technical metrics into tangible business outcomes. Instead of simply reporting a 15% reduction in bug resolution time, show how this translates into a 10% increase in customer satisfaction. This clearly connects project performance with business value, resonating with stakeholders and highlighting your project’s contribution to the company’s success.
Mastering the art of aligning Jira custom reports with broader business objectives is crucial. By carefully selecting the right metrics, establishing achievable targets, and presenting data compellingly, you transform reports from mere data summaries into powerful tools that drive informed decision-making and showcase project success.
Ready to streamline your team’s workflows and boost productivity, even during absences? Explore resolution’s Out of Office Assistant for Jira Cloud today!
