

Unlocking Peak Performance: Essential Metrics for Your Agile Team
Want to boost your agile team’s performance in 2025? Tracking the right agile team performance metrics is key. This listicle provides eight essential metrics to help your team identify strengths, pinpoint weaknesses, and deliver better products faster. Learn how to leverage metrics like velocity, lead time, cycle time, burndown rate, team happiness, code quality, customer satisfaction, and deployment frequency to gain a holistic view of your team’s performance. Use these data-driven insights to optimize your agile processes and achieve peak performance.
1. Velocity
Velocity is a crucial agile team performance metric that measures the amount of work a team completes during a sprint. It’s a powerful tool for predicting future sprint capacity and understanding productivity trends, making it essential for effective agile project management. In the context of agile team performance metrics, velocity holds a prominent position due to its direct link to team output and its usefulness in planning and forecasting. It provides a quantifiable measure of how much work a team can realistically handle, fostering data-driven decision-making and promoting continuous improvement.
Velocity is typically measured in story points, hours, or the number of completed user stories. Story points are a relative unit of measure that represent the effort, complexity, and uncertainty involved in completing a user story. Using story points allows teams to abstract away from specific time units, focusing instead on the overall size of the work. Alternatively, some teams opt to track velocity using actual hours spent or simply the number of completed user stories. Regardless of the chosen unit, the core concept remains the same: quantifying the amount of work delivered within a sprint.
Calculating velocity involves averaging the amount of work completed over several sprints. This provides a more stable and reliable measure than relying on the output of a single sprint. This average velocity then becomes a key input for sprint planning and forecasting. By understanding their average velocity, teams can make more realistic commitments about the amount of work they can take on in future sprints. This information also helps stakeholders understand realistic delivery timelines and manage expectations accordingly. Tracking velocity is commonly done through burndown charts and sprint reports, providing visual representations of progress and highlighting potential roadblocks.
Several successful organizations leverage velocity tracking to enhance their agile practices. Spotify, known for its autonomous squad model, uses velocity to plan releases and coordinate work across different teams. Microsoft’s Azure DevOps team tracks velocity to improve sprint predictability and optimize their development cycles. Similarly, ING Bank uses velocity metrics to balance workload and ensure efficient resource allocation across their agile teams. These examples illustrate how velocity can be applied across various industries and team structures to drive agile maturity.
To effectively utilize velocity in your agile practices, consider the following tips:
- Focus on trends rather than absolute numbers: Velocity is not a competition. Instead of aiming for artificially high velocity, focus on identifying trends and understanding how your team’s capacity evolves over time.
- Use velocity for internal planning, not team comparisons: Comparing velocity across different teams is meaningless due to variations in team size, skill sets, and working contexts. Use velocity solely for internal planning and improvement within your own team.
- Combine with other metrics for a complete picture: While velocity is valuable, it doesn’t tell the whole story. Combine it with other agile metrics, such as cycle time and lead time, to gain a more comprehensive understanding of team performance.
- Regularly review and adjust story point estimates: As your team gains experience and understanding of the work, periodically review and refine story point estimates to ensure they accurately reflect the effort required.
Velocity offers several advantages: it aids in realistic sprint planning and commitment, provides predictable delivery estimates to stakeholders, is easy to understand and communicate, and identifies team capacity trends over time. However, it also has some potential drawbacks: it can be manipulated by inflating story points, it may not reflect actual business value delivered, and it can create pressure to maintain artificially high numbers. By understanding these pros and cons, you can leverage velocity effectively while mitigating potential pitfalls.
The following infographic summarizes the key data points related to velocity:
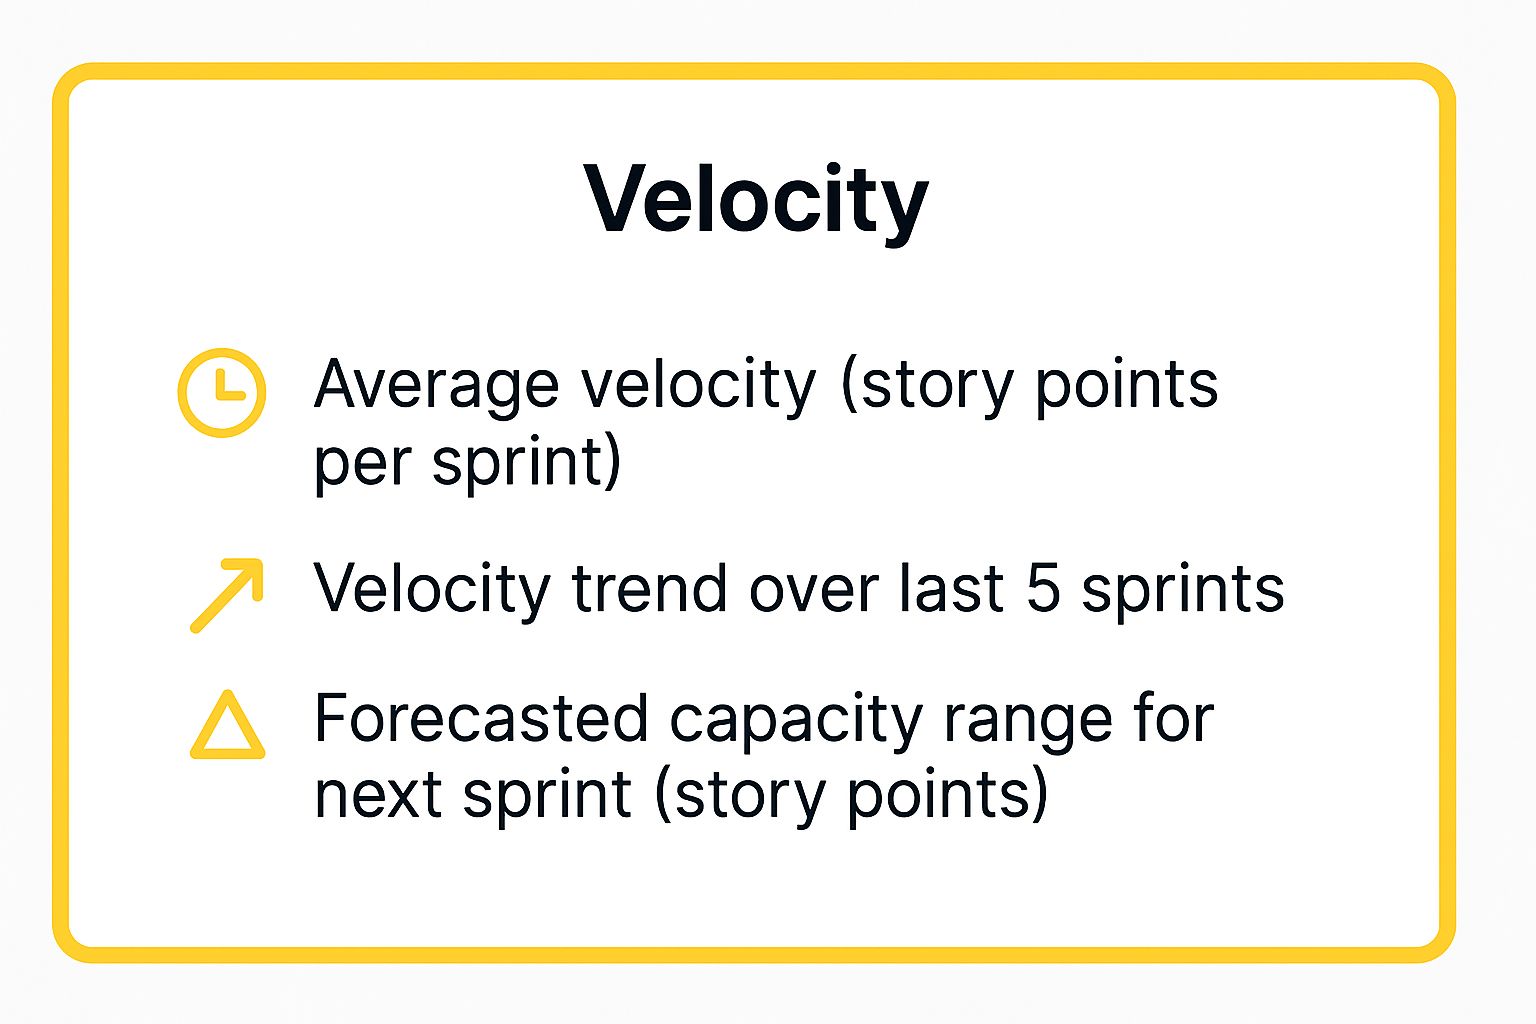
This infographic provides a quick reference to a team’s average velocity, the recent velocity trend, and the forecasted capacity for the next sprint. As we can see, the team’s velocity has been steadily increasing, suggesting improving performance and predictability. This positive trend allows for more confident sprint planning and stakeholder communication.
For a deeper understanding of how velocity interacts with backlog prioritization, learn more about Velocity. Properly prioritizing your product backlog is essential for maximizing the value delivered within each sprint and ensuring alignment with business objectives. This link provides valuable insights into various prioritization techniques that can be used in conjunction with velocity tracking to optimize your agile workflow.
2. Lead Time: A Customer-Centric Agile Team Performance Metric
Lead time is a crucial agile team performance metric that measures the total time elapsed from the moment a customer request (or user story) is initiated to the moment it’s delivered and available to the customer. Unlike metrics that focus solely on internal team velocity, lead time prioritizes the customer’s perspective, encompassing all waiting time, active work time, and any delays encountered throughout the development process. This makes it an invaluable metric for teams aiming to optimize their delivery speed and improve customer satisfaction. This positions lead time as a critical component of a robust suite of agile team performance metrics, allowing teams to understand and improve the overall flow of value to the customer.
How Lead Time Works and Why It Matters
Lead time tracking begins the instant a customer request is formally logged or a user story is created. This could be through a ticketing system, project management software, or even a simple email. The clock stops only when the customer receives the completed feature or functionality, signifying the end of the delivery cycle. This “end-to-end” perspective is what differentiates lead time from other metrics, as it captures the complete customer journey.
The inclusion of both active work time (coding, testing, design) and waiting time (approvals, handoffs, dependencies) is a key feature of lead time. This holistic view reveals potential bottlenecks within the entire value stream, highlighting areas where process improvements can have the most significant impact. Focusing solely on active work time can provide a false sense of efficiency if significant delays occur due to handoffs or approvals. Understanding where work sits idle allows teams to identify and eliminate these roadblocks, leading to faster delivery and improved customer satisfaction.
Lead Time in Action: Success Stories
Several organizations have leveraged lead time to significantly improve their development processes and customer experience. Netflix, known for its rapid innovation, dramatically reduced its deployment pipeline lead time from 40 minutes to 16 minutes. This enabled them to deploy updates and new features more frequently, enhancing the customer experience and maintaining their competitive edge. Similarly, Etsy, an online marketplace for handmade and vintage items, used continuous deployment practices to shorten their lead time from weeks to hours, enabling them to respond rapidly to customer needs and market changes. Capital One also uses lead time as a key metric to track the progress of their digital transformation, ensuring a customer-centric approach to their technology initiatives. These examples demonstrate the powerful impact of focusing on and optimizing lead time as a core agile team performance metric.
Actionable Tips for Implementing and Utilizing Lead Time
- Define Clear Start and End Points: Ambiguity can skew results. Precisely define what constitutes the “start” (e.g., ticket creation, sprint planning) and “end” (e.g., deployment to production, customer acceptance) of the lead time measurement.
- Categorize Work Items: Breaking down lead time by work item type, size, or complexity provides more granular insights. Tracking lead time for smaller, simpler tasks separately from large, complex projects can reveal specific areas for improvement.
- Target Waiting Time: Don’t just focus on reducing active work time. A significant portion of lead time is often spent waiting. Identify and address bottlenecks causing these delays to optimize the entire flow.
- Analyze Trends: Single data points aren’t as useful as trends. Track lead time over time to identify patterns, measure the impact of process improvements, and continuously optimize your delivery pipeline.
- Visualize with Cumulative Flow Diagrams: Cumulative flow diagrams provide a powerful visual representation of lead time and work in progress, making it easier to spot bottlenecks and understand flow.
When and Why to Use Lead Time
Lead time is particularly valuable in agile environments where rapid iteration and customer feedback are paramount. It’s essential for:
- Scrum Masters and Agile Coaches: To identify impediments and coach teams on improving flow.
- Software Development and Engineering Teams: To monitor delivery speed and identify areas for process optimization.
- Project and Product Managers: To set realistic expectations with stakeholders and track progress against goals.
- Remote and Cross-functional Teams: To understand handoffs and dependencies between different teams and individuals.
- Enterprise IT and Operations Departments: To measure the effectiveness of IT service delivery and identify areas for improvement.
Pros and Cons of Lead Time
Pros:
- Provides a customer-centric view of delivery performance.
- Identifies bottlenecks in the entire value stream.
- Helps set realistic customer expectations.
- Encourages focus on continuous flow.
Cons:
- Can be influenced by external factors beyond team control.
- May not account for varying complexity of work items.
- Requires careful definition of start and end points.
- Can be difficult to track across multiple systems.
Despite these potential challenges, lead time remains a powerful and insightful metric for any team aiming to optimize its delivery process and improve customer satisfaction. By focusing on the entire customer journey and identifying areas for improvement in both active work and waiting time, teams can significantly reduce lead time and deliver value faster. Its inclusion as a key agile team performance metric ensures a customer-centric focus and promotes a culture of continuous improvement.
3. Cycle Time
Cycle time is a crucial agile team performance metric that provides valuable insights into a team’s efficiency and workflow effectiveness. It measures the time it takes for a work item, such as a user story or task, to move from “work started” to “work completed.” This differs from lead time, which measures the entire duration from request initiation to delivery. Cycle time specifically focuses on the active work phase, filtering out wait times that can skew the understanding of a team’s internal performance. By focusing solely on active work, cycle time provides a clearer picture of the team’s actual work efficiency and helps pinpoint bottlenecks in the workflow. This focus makes it a powerful tool for optimizing team processes and improving predictability in an agile environment. This makes it an indispensable metric for those seeking to improve their agile team performance.
How Cycle Time Works:
Cycle time begins the moment work actively commences on a task and ends when that task is deemed complete and ready for delivery. This excludes any time spent waiting in a backlog, pending approvals, or blocked by dependencies. For example, if a developer picks up a user story from the “Ready to Start” column on a Kanban board and begins working, the cycle time clock starts ticking. Once they finish the development, testing, and any other defined criteria for completion, and move the story to the “Done” column, the cycle time clock stops.
Why Use Cycle Time as an Agile Team Performance Metric?
Cycle time’s strength lies in its ability to pinpoint inefficiencies within the team’s internal workflow. By isolating the active work period, it provides a clear view of how long it actually takes the team to complete tasks. This allows for a more accurate assessment of the team’s velocity and predictability, free from external factors that influence lead time. For teams looking to streamline their processes and enhance agile team performance, cycle time is a powerful diagnostic tool. It can help answer questions like: Are there bottlenecks in specific stages of our workflow? Is our estimation process accurate? Are there any impediments slowing down the team? Using cycle time, teams can focus their improvement efforts precisely where they are most needed.
Features and Benefits:
- Measures active work time only: This allows for accurate assessment of internal team efficiency, uninfluenced by external factors.
- Starts when work begins: Provides a clear picture of actual work effort.
- Helps identify workflow inefficiencies: Pinpoints bottlenecks and areas for improvement.
- Often tracked using Kanban boards and workflow tools: Facilitates easy visualization and tracking.
- Directly reflects team’s actual work efficiency: Allows for data-driven process improvements.
- Less influenced by external delays or prioritization changes: Provides a more stable measure of team performance.
- Helps optimize internal team processes: Facilitates continuous improvement.
- Useful for identifying workflow bottlenecks: Enables targeted interventions to streamline work.
Examples of Successful Implementation:
Several organizations have successfully used cycle time to improve their agile team performance. Atlassian, known for its agile project management tools, uses cycle time metrics to optimize its development workflow. Similarly, Slack tracks cycle time to improve its feature development process, ensuring faster delivery of new features to its users. GitHub, a platform widely used by developers, leverages cycle time measurements from the first commit to merge for pull requests, allowing them to better understand their development lifecycle and identify areas for improvement.
Pros and Cons:
While cycle time offers many advantages, it is essential to be aware of its limitations.
Pros: As discussed above, pros include accurate efficiency measurement, identification of workflow bottlenecks, and optimization of internal processes.
Cons:
- Doesn’t show complete customer experience: Doesn’t reflect the full lead time, which encompasses the entire customer journey.
- May encourage rushing work to reduce time: Overemphasis on cycle time without consideration for quality can be detrimental.
- Can vary significantly based on work complexity: Requires careful interpretation and contextualization.
- Requires clear definition of ‘work started’ state: Consistency in defining this state is crucial for accurate measurement.
Actionable Tips for Implementing and Utilizing Cycle Time:
- Track cycle time by work item size or type: This allows for more granular analysis and identification of specific bottlenecks.
- Use control charts to identify outliers and trends: Control charts can help visualize variations in cycle time and identify unusual patterns.
- Focus on reducing variation, not just average time: Consistent cycle times are crucial for predictability.
- Combine with lead time for complete delivery picture: Using both metrics provides a holistic view of the entire delivery process.
Popularized By:
The concept of cycle time in the context of software development and agile practices has been heavily influenced by David Anderson and practitioners of the Kanban methodology. Kanban’s focus on visualizing and managing workflow makes cycle time a natural and essential metric for optimizing flow and identifying areas for improvement.
By implementing and effectively utilizing cycle time as an agile team performance metric, teams can gain a deeper understanding of their internal processes, pinpoint areas for improvement, and ultimately deliver value faster and more efficiently.
4. Burndown Rate
Burndown Rate is a crucial agile team performance metric that tracks the completion of work throughout a sprint or release. It provides a visual representation of the remaining work over time, allowing teams to monitor progress and predict their likelihood of achieving sprint goals. This metric is a cornerstone of agile project management and offers valuable insights into team velocity and potential roadblocks. Its simplicity and visual nature make it easily understandable for both technical and non-technical stakeholders, fostering transparency and collaboration.

The Burndown Rate is typically displayed as a line graph. The vertical axis represents the remaining work (often measured in story points or hours), while the horizontal axis represents time (days of the sprint). An “ideal burndown line” represents the planned rate of completion, assuming a steady pace throughout the sprint. The “actual burndown line” plots the actual remaining work at the end of each day, reflecting the team’s true progress. By comparing these two lines, teams can quickly identify deviations and take corrective actions.
The Burndown Rate offers several key features:
- Visual representation of remaining work: The chart provides a clear and concise visualization of how much work remains in the sprint.
- Comparison of planned vs. actual progress: The inclusion of both ideal and actual burndown lines allows for easy identification of discrepancies and potential issues.
- Availability at sprint and release levels: The Burndown Rate can be used to track progress within individual sprints as well as across larger releases, offering flexibility in scope.
- Ideal burndown line for comparison: This provides a benchmark against which to measure actual progress, facilitating early detection of deviations.
Companies like Salesforce, Adobe, and SAP leverage burndown charts to manage their agile workflows. Salesforce utilizes them across all scrum teams for sprint tracking. Adobe employs burndown rates to manage complex product releases, ensuring projects stay on track. Similarly, SAP uses release burndown charts to navigate large-scale agile transformations, providing a high-level overview of progress.
While the Burndown Rate is a powerful agile team performance metric, it’s essential to be aware of its limitations. Frequent scope changes can make the chart misleading, as the initial estimations become irrelevant. It may also not accurately reflect the actual value delivered, focusing solely on task completion rather than business impact. Over-reliance on the burndown can create pressure to remove scope instead of addressing underlying issues, potentially compromising the product’s quality. It also doesn’t inherently account for variations in work quality.
To maximize the effectiveness of Burndown Rate tracking, consider these tips:
- Update daily: Consistent daily updates ensure accuracy and allow for timely identification of trends.
- Address deviations promptly: Significant deviations from the ideal line should be investigated and addressed immediately to prevent sprint derailment.
- Use burnup charts for scope changes: Supplementing burndown charts with burnup charts can provide a clearer picture when scope changes occur, as burnup charts track total work completed.
- Focus on trends: Avoid overreacting to daily fluctuations; instead, focus on broader trends to gain meaningful insights into team performance.
The Burndown Rate earns its place among essential agile team performance metrics because it provides a simple yet effective way to visualize progress, predict outcomes, and foster transparency. By understanding its strengths and limitations and applying best practices, teams can leverage this metric to improve their agile workflows and deliver successful projects. It’s a valuable tool for Scrum Masters, Agile Coaches, and anyone involved in managing agile projects, contributing significantly to efficient project execution and improved team performance. By understanding and actively utilizing the Burndown Rate, teams can significantly enhance their agile practices and deliver successful projects.
5. Team Happiness Index
In the dynamic world of agile development, where speed and adaptability are paramount, it’s easy to overlook the human element. However, a team’s emotional well-being plays a crucial role in its overall performance. The Team Happiness Index is an agile team performance metric designed to measure team members’ satisfaction, motivation, and overall well-being, acknowledging the direct link between happiness and productivity. By regularly assessing and addressing the emotional state of your team, you can foster a more positive and productive work environment, ultimately leading to improved project outcomes. This metric recognizes the simple truth: happy teams tend to be more productive, creative, and more likely to deliver high-quality work.

This metric deserves its place in the list of agile team performance metrics because it addresses a critical, often overlooked, aspect of team success: the human factor. While metrics like velocity and sprint burndown charts provide valuable insights into the pace of work, the Team Happiness Index sheds light on the underlying emotional currents that can significantly impact performance. By incorporating this metric, agile teams can proactively address potential issues and cultivate a healthier, more sustainable work environment.
The Team Happiness Index can be measured through various methods, including regular pulse surveys, mood tracking tools, or even informal check-ins. These assessments often explore factors such as autonomy, mastery, and purpose—key elements known to contribute to job satisfaction and motivation. The frequency of these assessments can vary depending on the team’s needs, ranging from daily or weekly check-ins to monthly surveys. Features like anonymity in surveys can encourage more honest responses. Learn more about Team Happiness Index.
Several successful examples demonstrate the value of this metric. Spotify, known for its innovative squad model, uses the happiness index as a key health metric for its teams. Buffer, a social media management platform, tracks team happiness alongside traditional business metrics, demonstrating its commitment to employee well-being. Even large organizations like the Haier Group, a Chinese multinational home appliances and consumer electronics company, incorporate happiness metrics into their RenDanHeYi management model.
While the benefits are numerous, there are also potential drawbacks to consider. The subjective nature of happiness makes it susceptible to variations based on individual personalities and temporary external factors. Additionally, while a correlation between happiness and productivity is generally observed, the relationship isn’t always straightforward and may not directly translate into specific business outcomes. Consistent participation is also vital for meaningful results, as sporadic feedback can skew the data.
To effectively implement the Team Happiness Index in your agile team, consider the following tips:
- Keep surveys short and anonymous: Brevity encourages participation, and anonymity fosters honest feedback.
- Act on feedback: Demonstrate that you value team input by addressing concerns and implementing suggested improvements. This will maintain high survey participation rates.
- Track trends rather than absolute scores: Look for patterns over time to identify underlying issues and measure the impact of interventions.
- Combine with other metrics: Use the Team Happiness Index in conjunction with other agile team performance metrics for a comprehensive picture of team health and performance. Understanding velocity alongside happiness can provide a more nuanced understanding of team dynamics.
When should you use this approach? The Team Happiness Index is particularly valuable for scrum masters, agile coaches, software development teams, project and product managers, remote and cross-functional teams, and enterprise IT and operations departments. It’s beneficial in situations where team morale might be impacted by factors such as high pressure, rapid change, or remote work environments. It’s a valuable tool for promoting team sustainability, retaining top talent, and fostering a positive and productive work environment, making it a key component of any robust set of agile team performance metrics. By actively monitoring and nurturing team happiness, you can unlock the full potential of your agile team and achieve sustainable high performance.
6. Code Quality Metrics
Code quality metrics play a crucial role in evaluating agile team performance, contributing significantly to long-term project success and sustainability. While agile methodologies prioritize delivering working software quickly, maintaining high code quality ensures that the rapid pace of development doesn’t come at the cost of maintainability, scalability, and reduced technical debt. These metrics provide valuable insights into the technical health of a project, enabling teams to identify potential problems early and implement corrective measures. Therefore, code quality metrics deserve a prominent place in any assessment of agile team performance.
This category of agile team performance metrics encompasses various technical measurements that offer a comprehensive view of the codebase’s health. These measurements include, but aren’t limited to:
- Code Coverage: This metric measures the percentage of code executed during testing, providing an indication of how thoroughly the codebase has been tested. High code coverage can help identify untested areas and reduce the likelihood of undetected bugs.
- Cyclomatic Complexity: This metric quantifies the number of independent paths through a section of code, representing its complexity. High cyclomatic complexity can indicate code that is difficult to understand, test, and maintain.
- Maintainability Index: This metric combines several factors, including code complexity, code size, and comment density, to provide an overall assessment of how easy the code is to maintain. A higher maintainability index suggests code that is more understandable and less prone to errors during modifications.
- Technical Debt: This refers to the implied cost of rework caused by choosing an easy solution now instead of a better approach that would take longer. Code quality metrics help track the accumulation of technical debt by identifying areas of the codebase that need refactoring or improvement.
- Defect Density: This metric measures the number of defects found per unit of code, such as per thousand lines of code (KLOC). Tracking defect density helps identify trends in code quality and assess the effectiveness of testing and quality assurance efforts.
- Defect Escape Rate: This represents the percentage of defects that escape detection during testing and make it into production. Monitoring defect escape rates helps improve testing processes and minimize the impact of defects on end-users.
Many of these metrics can be automated through Continuous Integration/Continuous Delivery (CI/CD) pipelines, enabling teams to track code quality continuously and identify issues early in the development cycle.
Examples of Successful Implementation:
Several leading tech companies leverage code quality metrics as a cornerstone of their development practices:
- Google: Known for their rigorous engineering culture, Google maintains strict code quality gates, including mandatory code reviews and automated code quality checks.
- Netflix: Netflix utilizes automated code quality checks within their robust deployment pipeline, ensuring that code meets specific quality standards before being released to production.
- Microsoft: Across Azure services, Microsoft enforces code coverage thresholds and other quality metrics to ensure the reliability and maintainability of their cloud platform.
Actionable Tips for Implementation:
- Set Realistic Thresholds: Define achievable thresholds for each metric based on the specific project context, team experience, and industry best practices. Avoid setting unrealistic targets that could lead to gaming the system.
- Combine Multiple Metrics: Relying on a single metric can be misleading. Combine multiple code quality metrics to gain a comprehensive understanding of the codebase’s health and avoid blind spots.
- Automate Quality Checks: Integrate automated code quality analysis tools into your CI/CD pipeline to provide continuous feedback and prevent the accumulation of technical debt.
- Focus on Trends and Improvement: Rather than fixating on absolute numbers, focus on tracking trends over time and identifying areas for improvement. Consistent progress is more important than achieving arbitrary targets.
Pros and Cons:
Pros:
- Prevents technical debt accumulation, leading to more sustainable development practices.
- Improves long-term maintainability, making it easier and less expensive to modify and enhance the codebase.
- Reduces production defects, leading to higher quality software and improved user satisfaction.
- Supports refactoring decisions by providing data-driven insights into areas of the codebase that need improvement.
Cons:
- Can be gamed or manipulated if developers prioritize meeting metric targets over writing high-quality code.
- May not reflect actual business value, as code that meets all quality standards might not necessarily fulfill user needs.
- Risk of over-engineering for metrics, leading to unnecessary complexity and increased development time.
- Requires tool setup and maintenance, which can add overhead to the development process.
By carefully selecting and implementing code quality metrics within agile frameworks, development teams can enhance software quality, improve maintainability, and reduce long-term costs. Focusing on trends, setting realistic goals, and integrating automated tools into the development process are crucial for leveraging the full potential of code quality metrics as a valuable agile team performance indicator. These metrics contribute significantly to achieving the core agile principles of delivering high-quality software frequently and efficiently.
7. Customer Satisfaction Score
Customer Satisfaction Score (CSAT) is a crucial agile team performance metric that measures how effectively delivered features meet customer needs and expectations. In the fast-paced world of agile development, where rapid iterations and continuous delivery are paramount, it’s easy to lose sight of the ultimate goal: delivering value to the customer. CSAT serves as a critical link between agile team output and actual business value, providing a direct measure of customer outcomes. This metric deserves its place in any list of top agile team performance metrics because it directly reflects the success of the agile process in delivering valuable solutions. By focusing on CSAT, agile teams can ensure they are building the right product, the right way. For scrum masters, agile coaches, and product managers, tracking CSAT is essential for understanding whether the team’s efforts are translating into positive customer experiences.
CSAT works by gathering direct feedback from customers about their experiences with specific features or the product as a whole. This feedback can be collected through various channels, including surveys, in-app feedback forms, user interviews, and social media monitoring. Often, CSAT incorporates established rating systems like Net Promoter Score (NPS), which asks how likely a customer is to recommend the product or service, and traditional CSAT ratings, typically measured on a scale of 1 to 5 or 1 to 7, representing levels of satisfaction. Beyond simple ratings, analyzing feature adoption and usage patterns provides valuable insights into how customers interact with the delivered functionalities. By linking team output to these customer outcomes, agile teams gain a clear understanding of what resonates with users and what needs improvement. This data becomes invaluable for prioritizing future development and shaping the product roadmap.
Several successful companies have integrated CSAT into their agile processes. Amazon’s famed “two-pizza teams,” small, autonomous units responsible for specific services, meticulously track customer satisfaction for their respective areas. This allows them to quickly identify and address customer pain points, ensuring a high level of service quality. Similarly, Slack measures customer satisfaction for each major feature release, gaining valuable feedback to iterate and improve upon subsequent releases. Airbnb uses CSAT scores to guide product development priorities, ensuring their platform continues to meet the evolving needs of its users. These examples demonstrate how CSAT, when effectively implemented, can drive customer-centric product development.
To effectively utilize CSAT within your agile team, consider the following actionable tips:
- Collect feedback continuously: Don’t wait for major releases to gather customer feedback. Implement systems for continuous feedback collection, allowing the team to address issues and iterate quickly.
- Diversify feedback channels: Relying on a single feedback method can lead to biased results. Utilize multiple channels like surveys, in-app feedback, and user interviews to capture a more comprehensive picture of customer sentiment.
- Link satisfaction scores to specific features or improvements: This allows teams to directly correlate their work with customer satisfaction, providing clear insights into the impact of specific changes.
- Close the feedback loop: Acting on collected feedback is crucial. Communicate changes and improvements back to customers, demonstrating that their input is valued and acted upon.
While CSAT offers substantial benefits for agile teams, it’s also essential to be aware of its potential drawbacks. Feedback loops can sometimes be delayed, especially when relying on periodic surveys. External factors beyond the team’s control can also influence customer satisfaction, making it challenging to isolate the impact of specific features. Gathering comprehensive feedback can require significant effort, and ensuring representative sampling can be difficult. Despite these challenges, the benefits of directly measuring business value delivery, focusing the team on customer outcomes, validating product decisions, and prioritizing future development significantly outweigh the potential drawbacks.
When implementing CSAT as one of your key agile team performance metrics, remember your target audience. Whether you are a scrum master facilitating the process, an agile coach guiding the team, a software engineer building the product, a project or product manager defining the roadmap, or part of a remote or cross-functional team collaborating on delivery, understanding and utilizing CSAT is essential. For enterprise IT and operations departments, CSAT provides critical insights into the effectiveness of delivered services.
Learn more about Customer Satisfaction Score
By incorporating CSAT into your agile framework and following the tips outlined above, your team can gain valuable insights into customer perceptions, improve product development, and ultimately deliver more valuable solutions that meet customer needs and drive business success. This focus on customer-centric development ensures that agile teams are not just building software, but building solutions that truly resonate with their users. This is why CSAT stands as a cornerstone of effective agile team performance metrics.
8. Deployment Frequency
Deployment Frequency, a crucial agile team performance metric, measures how often a team successfully releases code to production. It serves as a powerful indicator of a team’s ability to deliver value continuously and reflects their DevOps maturity and overall agile effectiveness. For scrum masters, agile coaches, software development teams, and even product managers, understanding and tracking Deployment Frequency is paramount to optimizing the software development lifecycle. Even for enterprise IT and operations departments, this metric can offer valuable insights into the efficiency and agility of their software delivery processes. In today’s fast-paced technological landscape, frequent deployments are no longer a luxury, but a necessity for remaining competitive.
This metric tracks successful production deployments over time, encompassing both planned releases and emergency hotfixes. It’s typically measured in deployments per day, week, or month, providing a quantifiable measure of the team’s continuous delivery maturity. The higher the frequency, the more mature the team is generally considered in their continuous delivery practices. This is because a high deployment frequency suggests a streamlined and automated deployment pipeline, a hallmark of successful DevOps implementation.
A high Deployment Frequency offers several benefits. It encourages continuous value delivery by enabling teams to release smaller batches of work more often, leading to faster feedback loops with customers and stakeholders. This rapid feedback cycle allows for quicker adjustments and course corrections, ensuring the product stays aligned with market needs. Moreover, frequent deployments inherently reduce risk by minimizing the impact of each individual release. Instead of large, infrequent deployments that carry significant risk of failure, smaller, more frequent deployments isolate potential issues and make them easier to address. Furthermore, a high Deployment Frequency often signifies healthy DevOps practices, indicating a strong emphasis on automation, collaboration, and continuous improvement.
However, focusing solely on Deployment Frequency without considering other factors can be detrimental. Teams might be tempted to deploy code without delivering actual user value, simply to inflate the metric. This can lead to a proliferation of insignificant releases that add little to the product and potentially confuse users. Furthermore, achieving a high Deployment Frequency necessitates a mature and robust deployment infrastructure, including automated testing and deployment pipelines. Without this foundation, frequent deployments can become a source of instability and increase the risk of errors. Another potential pitfall is prioritizing frequency over quality. Teams may rush deployments to meet frequency targets, sacrificing thorough testing and potentially releasing buggy software. It’s crucial to measure Deployment Frequency alongside quality metrics like defect rate and customer satisfaction to ensure a balanced approach. Finally, Deployment Frequency may not accurately reflect actual feature delivery, especially if teams are using feature flags. Features can be deployed but remain inactive until toggled on, meaning the deployed code may not immediately provide value to the user.
Several industry giants exemplify the benefits of high Deployment Frequency. Amazon, known for its relentless focus on speed and customer satisfaction, reportedly deploys code to production every 11.7 seconds on average. Netflix performs thousands of deployments per day across its vast network of services, enabling rapid innovation and constant improvement. Etsy, an online marketplace for handmade and vintage items, successfully transitioned from monthly deployments to multiple deployments daily, dramatically accelerating their development cycle and responsiveness to customer needs. These examples highlight the transformative potential of embracing a culture of frequent deployments.
To effectively leverage Deployment Frequency as an agile team performance metric, consider the following tips: Focus on successful deployments, not just attempts. Failed deployments indicate underlying issues that need to be addressed and shouldn’t be counted towards the metric. Invest in automated testing and deployment pipelines to streamline the release process and minimize manual intervention. Learn more about Deployment Frequency. Crucially, measure Deployment Frequency alongside quality metrics like defect rate and customer satisfaction to avoid trade-offs between speed and quality. Finally, consider using feature flags to decouple deployment from release, allowing teams to deploy code frequently without immediately exposing it to users. This provides greater control over the rollout of new features and minimizes disruption.
By understanding the nuances of Deployment Frequency and implementing these practical tips, teams can leverage this powerful metric to accelerate their development cycles, enhance their DevOps maturity, and ultimately deliver greater value to their customers. This metric deserves its place in the list of essential agile team performance metrics because it provides a tangible measure of a team’s ability to embrace continuous delivery and adapt to the ever-changing demands of the modern software development landscape.
Agile Team Metrics Comparison
| Metric | 🔄 Implementation Complexity | 💡 Resource Requirements | ⭐ Expected Outcomes | 📊 Ideal Use Cases | ⚡ Key Advantages |
|---|---|---|---|---|---|
| Velocity | Moderate: requires tracking story points and sprints | Team effort for estimation and tracking | Predictable delivery, capacity forecasting | Sprint planning, capacity management | Easy to understand, identifies capacity trends |
| Lead Time | Moderate: start/end points must be clearly defined | Data collection across process stages | Customer-centric delivery time insights | Delivery performance, bottleneck identification | Reveals bottlenecks, sets realistic customer expectations |
| Cycle Time | Low to moderate: track from work start to done | Workflow tool integration for tracking | Reflects active work efficiency | Process optimization, workflow bottlenecks | Focuses on actual work time, less affected by delays |
| Burndown Rate | Low: visual tracking of remaining work | Regular updates and monitoring | Visual progress, sprint goal prediction | Sprint/release tracking, scope management | Clear visual progress, easy stakeholder communication |
| Team Happiness Index | Moderate: requires regular surveys and participation | Survey tools and cultural buy-in | Team satisfaction and well-being insights | Team health monitoring, talent retention | Early warning on team issues, correlates with productivity |
| Code Quality Metrics | High: requires automated tools and integration | Setup and maintenance of quality tools | Sustainable codebase, defect reduction | Code maintainability, defect tracking | Prevents technical debt, supports refactoring decisions |
| Customer Satisfaction Score | Moderate: requires continuous feedback collection | Survey tools, analytics, and customer engagement | Business value validation, customer outcome focus | Product validation, feature prioritization | Directly links output to customer value |
| Deployment Frequency | Moderate to high: requires mature deployment pipeline | Automated CI/CD pipelines and testing | Continuous value delivery, DevOps maturity | Release management, continuous delivery maturity | Encourages frequent releases, reduces deployment risk |
Driving Continuous Improvement with Agile Team Performance Metrics
Effectively leveraging agile team performance metrics is crucial for driving continuous improvement in any agile environment. From understanding your team’s velocity and lead time to monitoring cycle time, burndown rate, and even less tangible metrics like team happiness and customer satisfaction, each data point offers a piece of the puzzle. By analyzing metrics like code quality and deployment frequency, you gain a holistic view of your team’s strengths and weaknesses, enabling data-driven decisions that optimize performance. Remember, the goal isn’t to compare teams or micromanage, but rather to foster a culture of continuous improvement. Mastering the application of these agile team performance metrics empowers teams to identify bottlenecks, streamline processes, and ultimately deliver higher-quality products faster, leading to increased customer satisfaction and greater business value.
The most significant takeaway is that these metrics should be used proactively to identify areas for growth and celebrate successes. Start small, focus on the metrics most relevant to your team’s current challenges, and iterate based on the data you collect. By embracing a data-driven approach, your team can unlock its full potential and achieve remarkable results.
Want to improve your team’s communication, accountability, and overall performance? Resolution’s NASA – Not Another Standup App helps centralize meeting journals and provides valuable insights into team morale, directly supporting improvement initiatives based on your agile team performance metrics. Visit resolution Reichert Network Solutions GmbH to learn more and empower your team to reach new heights.
