
The project status report. For many, these words conjure images of dense spreadsheets, unread email chains, and tedious meetings. But what if your status report became a powerful tool for alignment, risk mitigation, and decision-making instead of a bureaucratic chore? The difference lies not in filling out a template, but in choosing the right format and content for your specific audience and project context. A generic, one-size-fits-all approach often fails, leaving stakeholders confused and your team’s hard work misunderstood. The key is to communicate progress, problems, and projections with precision and clarity.
This guide moves beyond generic templates to provide a curated collection of diverse project status report examples, each strategically broken down for practical application. We will analyze seven distinct reports, from an executive dashboard to an agile sprint summary, detailing not just what they contain but why they are effective. For each example, you will find a tactical analysis, actionable takeaways, and replicable methods you can immediately apply. You’ll learn how to tailor your reporting to specific industries like IT, construction, and marketing, ensuring your updates resonate with stakeholders and drive your projects forward. Let’s explore how to transform your reporting from a simple update into a strategic asset.
1. Executive Dashboard Status Report
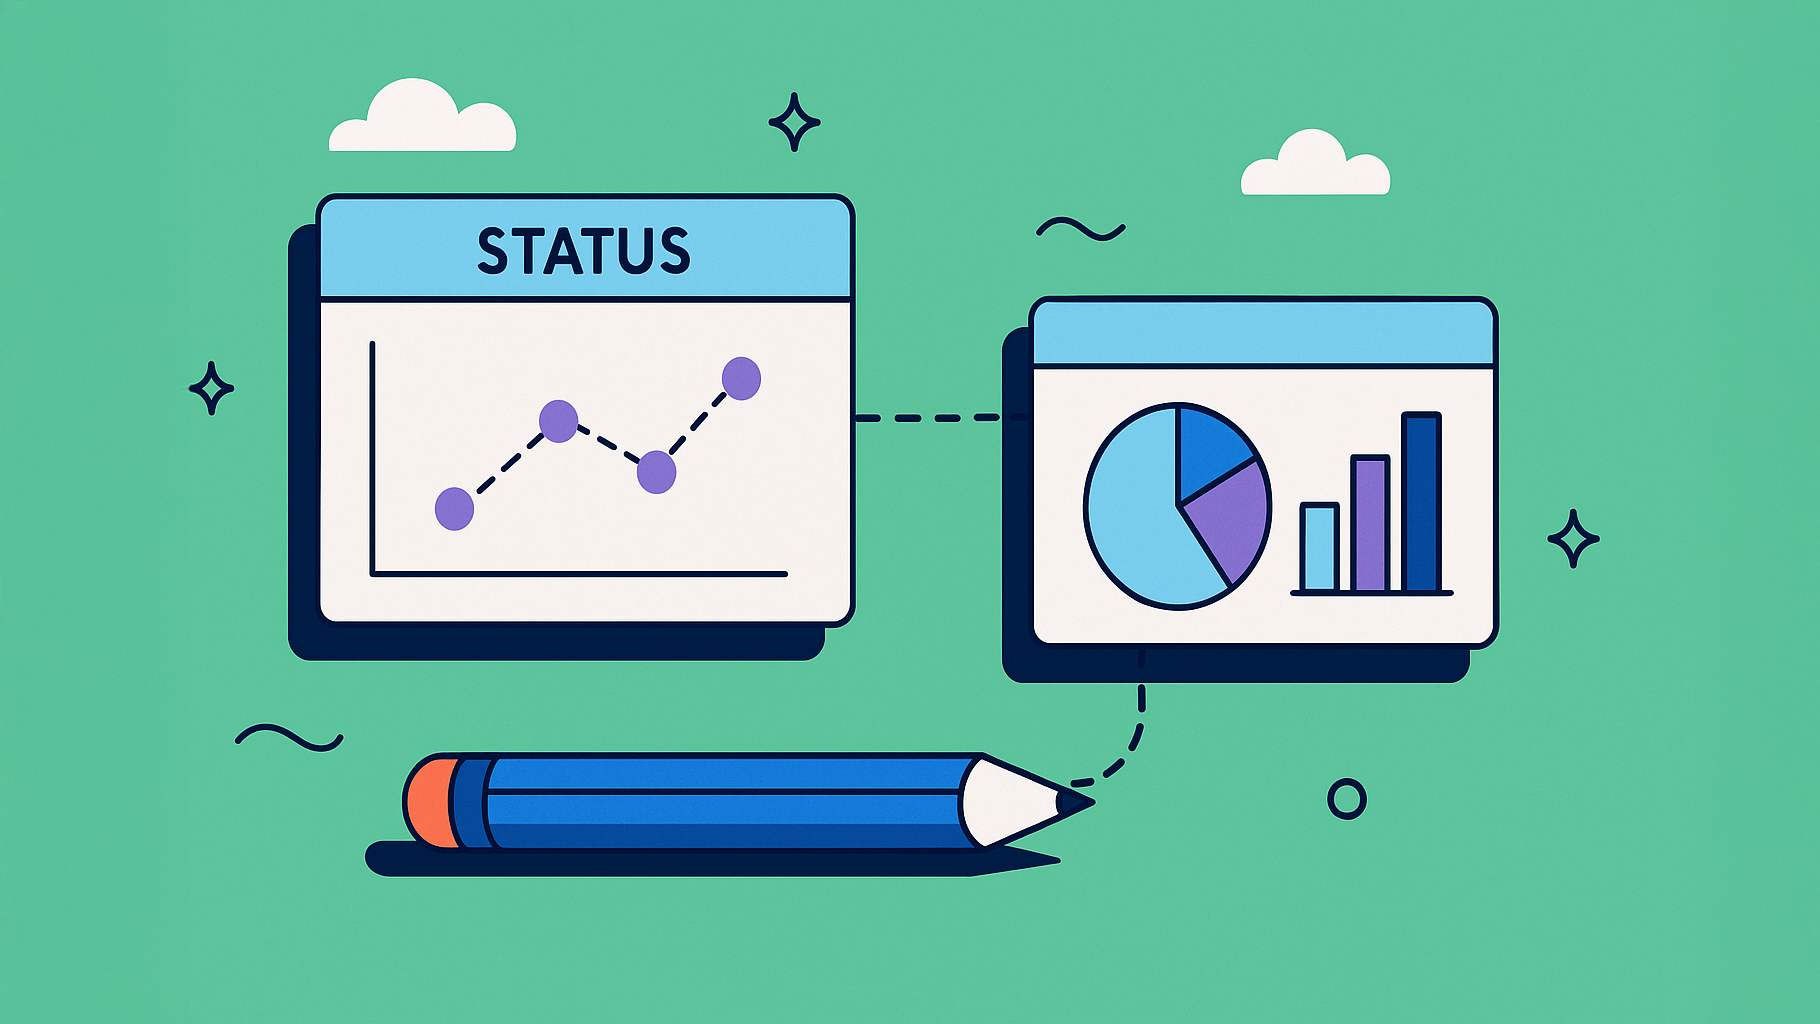
An Executive Dashboard Status Report is a high-level, visual summary designed to give senior leadership a rapid, at-a-glance understanding of a project’s health. Unlike detailed reports for project teams, this format prioritizes brevity and clarity, using charts, graphs, and RAG (Red, Amber, Green) status indicators to communicate progress, risks, and key metrics.
This type of report distills complex project data into its most critical components: budget, schedule, scope, and risks. It is a cornerstone of effective stakeholder communication, particularly in large organizations like those in the Fortune 500 or major government agencies where executive time is scarce. The methodology, popularized by consulting firms like McKinsey & Company, emphasizes data visualization to tell a compelling story about project performance.
Strategic Analysis & Breakdown
The power of the executive dashboard lies in its ability to quickly signal where leadership attention is needed. A well-designed dashboard doesn’t just present data; it guides the executive to a conclusion. Trend arrows showing if a metric is improving or declining are more valuable than static numbers.
Strategic Insight: The goal is not just to report status but to facilitate decisive action. By highlighting only the most critical roadblocks, you direct executive influence precisely where it can have the greatest impact, preventing leaders from getting lost in operational details.
Effective dashboards often draw from real-time data sources. For teams working on software or technical projects, integrating live metrics is key. When building one, applying some fundamental application performance monitoring dashboard tips can ensure the data is both accurate and insightful. This approach transforms the report from a static snapshot into a dynamic decision-making tool.
The following infographic highlights the core components typically found in these executive-level project status report examples.
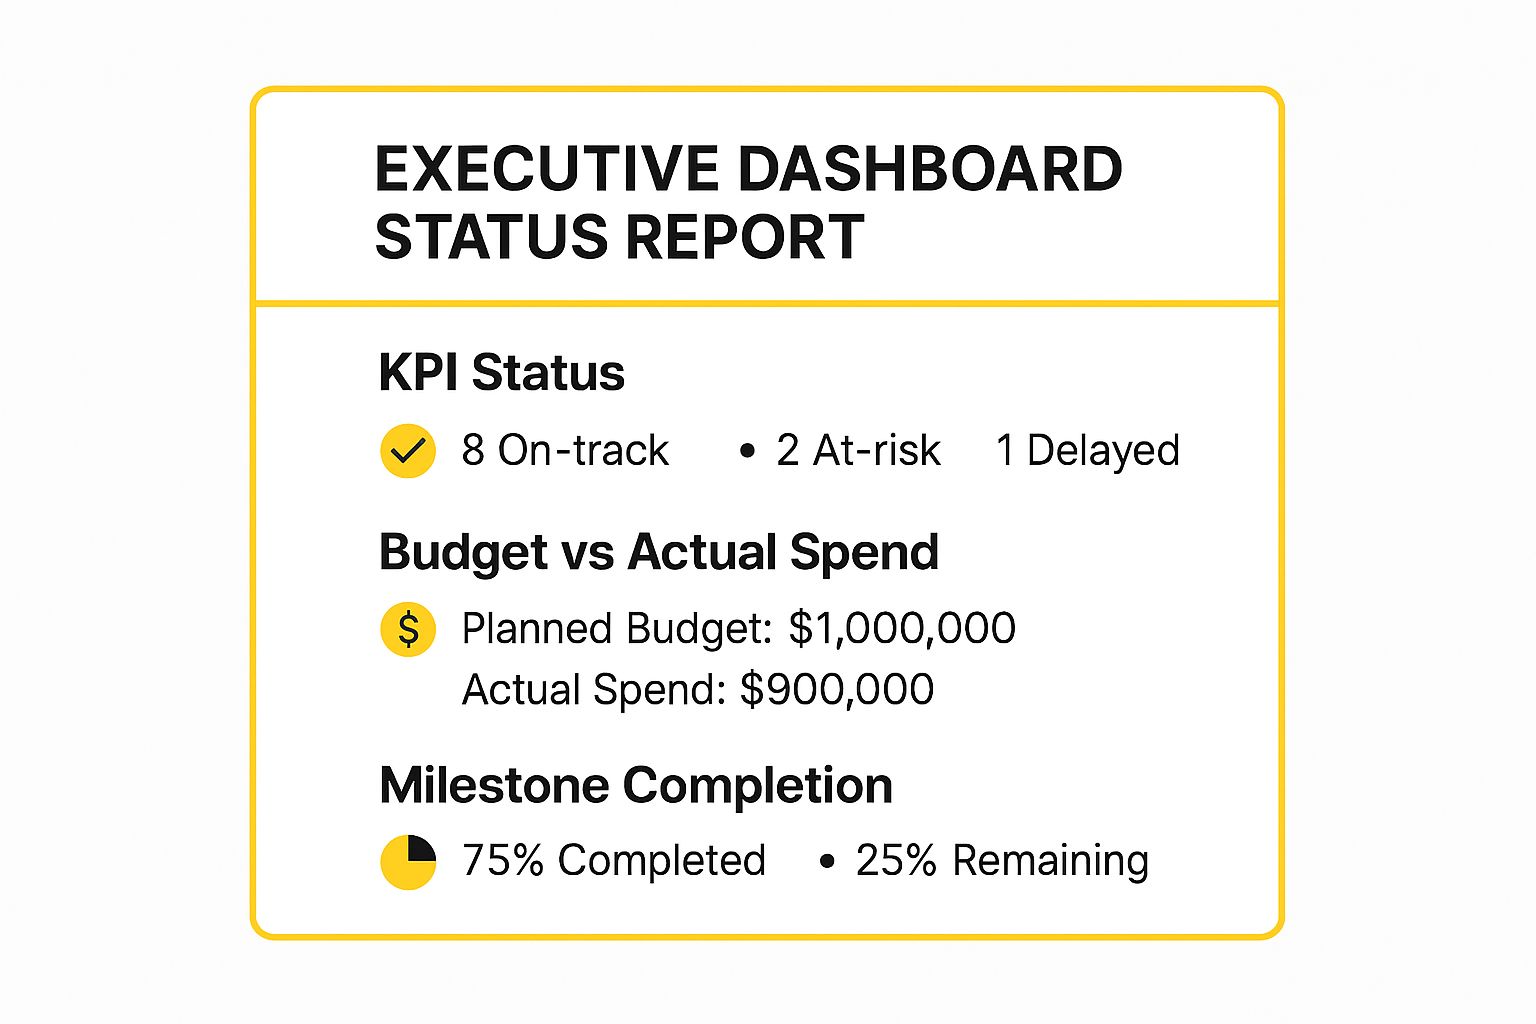
This visual summary immediately tells an executive that while most KPIs are healthy, the budget requires attention and milestone progress is on track.
Actionable Takeaways
To implement this report effectively:
- Standardize Color Coding: Use consistent colors for status (e.g., green for on-track, yellow for at-risk, red for delayed) across all projects to create a universal language for your leadership team.
- Embrace the One-Page Rule: Force conciseness by limiting the report to a single page or screen. This discipline ensures you only include the most vital information.
- Focus on Exceptions: Prioritize highlighting issues and decisions that specifically require executive intervention.
This approach is a critical element of any robust stakeholder communication strategy. Building an effective dashboard is a key step, but it must be part of a larger plan. Learn more about developing a comprehensive stakeholder communication plan from Resolution.de.
2. Agile Sprint Status Report
An Agile Sprint Status Report is an iterative reporting format tailored for development teams using methodologies like Scrum. It moves away from long-term, static plans to focus on the immediate progress within a specific time-boxed sprint. This report translates the dynamic nature of agile work into a digestible summary for stakeholders, tracking key metrics like sprint goals, velocity, and impediments.
This approach was inherently popularized by the creators of Scrum, Ken Schwaber and Jeff Sutherland, and has been refined by agile-first companies like Atlassian and Spotify. Unlike traditional reports that look months ahead, the sprint report provides a real-time pulse check on the team’s capacity and delivery cadence, making it one of the most relevant project status report examples for software development. It serves as a crucial communication tool between the product owner, the development team, and other stakeholders.

Strategic Analysis & Breakdown
The strategic value of a sprint status report is its focus on trends and team health rather than just task completion. A burndown chart, for instance, doesn’t just show work remaining; it visualizes the team’s progress against an ideal path, immediately flagging if the sprint is at risk of falling behind. This allows for early intervention and collaborative problem-solving during the daily stand-up meetings.
Strategic Insight: This report is less about “what” was done and more about “how” the team is working. The focus should be on velocity trends over multiple sprints and identifying recurring impediments. This shifts the conversation from micromanagement to process improvement and removing systemic blockers.
Leading agile teams automate the generation of these reports. By integrating directly with tools like Jira or Azure DevOps, metrics like burndown, cycle time, and velocity are pulled automatically, eliminating manual effort and ensuring data accuracy. This turns the report from a chore into a powerful, data-driven artifact for retrospectives and planning. To go deeper into this methodology, explore the principles of agile project development from Resolution.de.
Actionable Takeaways
To implement this report effectively:
- Automate Data Collection: Link your reporting template directly to your project management tool (e.g., Jira, Trello) to pull live data for burndown and velocity charts, saving time and reducing errors.
- Focus on Trends, Not Absolutes: Report on velocity over the last 3-5 sprints. A single sprint’s performance can be an anomaly, but a trend indicates a genuine change in team capacity or process efficiency.
- Include Qualitative Insights: Supplement quantitative data with a brief narrative. What were the key learnings? What unexpected challenges arose? This context is vital for stakeholders to truly understand the team’s progress.
3. Construction Project Status Report
A Construction Project Status Report is a specialized document tailored for the unique demands of infrastructure and building projects. It provides a comprehensive overview that extends beyond typical project metrics to include safety, regulatory compliance, physical progress, and environmental factors like weather. This format is essential for communicating with stakeholders ranging from investors and clients to site supervisors and regulatory bodies.
Unlike software or business projects, construction reporting must translate abstract plans into tangible, physical reality. This type of report, heavily utilized by industry leaders like Turner Construction and Bechtel Corporation, often integrates visual evidence such as site photos and drone footage. Its methodology, championed by organizations like the Associated General Contractors of America (AGC), ensures all stakeholders have a clear, evidence-backed view of on-the-ground progress and challenges.

Strategic Analysis & Breakdown
The effectiveness of a construction status report hinges on its ability to connect schedule and budget to physical reality. It must meticulously document safety incidents, material deliveries, and subcontractor performance. For construction projects, the underlying data that feeds these reports often originates from specialized tools; you can explore resources on how construction calculation software contributes to project tracking.
Strategic Insight: In construction, the report is an evidentiary record. Its primary function is to create an objective, documented history of the project’s lifecycle, which is critical for managing contracts, claims, and compliance. Transparency about delays caused by external factors, like weather or supply chain issues, is not just good practice-it’s a contractual necessity.
This report must also track leading indicators, not just lagging ones. For instance, reporting on “safety training hours completed” (a leading indicator) is more proactive than only reporting on “lost time incidents” (a lagging indicator). The following video provides a practical look at the daily reporting process on a construction site.
Actionable Takeaways
To implement this report effectively:
- Establish a Visual Baseline: Use consistent photo angles and drone footage paths from the very start. This creates a powerful time-lapse effect, making progress (or lack thereof) undeniable.
- Integrate a Weather Log: Systematically record daily weather conditions (temperature, precipitation, wind). This data provides concrete evidence to justify schedule variances and supports requests for extensions.
- Track Safety Proactively: Focus on leading safety metrics like safety observations, near-miss reports, and toolbox talk attendance. This fosters a preventative safety culture rather than a reactive one.
This detailed reporting method provides the structure needed for complex physical projects. To apply these principles more broadly, you can adapt a weekly project status update template from Resolution.de to include some of these construction-specific fields.
4. IT Project Status Report
An IT Project Status Report is a specialized format tailored for technology-centric projects, focusing on technical health alongside traditional project metrics. It goes beyond schedule and budget to include system performance, security vulnerabilities, testing progress, and deployment readiness. This report is essential for communicating the intricate details of infrastructure upgrades, software development, and system integrations to both technical teams and business stakeholders.
These reports are heavily influenced by frameworks like the IT Infrastructure Library (ITIL) and practices popularized by major IT consulting firms such as Accenture and IBM. They often integrate directly with IT service management (ITSM) and monitoring tools to pull real-time data on uptime, response times, and error rates. This technical depth ensures that decisions are based on hard data, not just subjective assessments, making it a critical tool in enterprise software implementation and government IT modernization projects.
Strategic Analysis & Breakdown
The strength of an IT project status report lies in its ability to translate complex technical information into business impact. It must clearly connect server capacity issues to potential revenue loss or link a security patch delay to a specific compliance risk. This format forces a dialogue between technical and non-technical stakeholders, ensuring alignment on priorities and resource allocation.
Strategic Insight: The most effective IT reports create two versions from a single source of truth: a detailed technical view for the engineering team and a summarized business-impact version for leadership. This prevents executives from getting lost in technical jargon while still giving engineers the granular data they need.
A key section often missing from other reports is a technical debt tracker. This explicitly documents compromises made for speed, such as using a temporary workaround or skipping refactoring. Tracking this debt makes it a visible and quantifiable part of the project, ensuring it is addressed later rather than forgotten. The goal is to provide a complete picture of project health, including the underlying quality of the technology being built.
Actionable Takeaways
To implement this report effectively:
- Automate Metric Collection: Integrate your reporting with monitoring tools (e.g., Datadog, New Relic) to pull live data on system performance, eliminating manual entry and ensuring accuracy.
- Translate Tech to Business: For every technical issue or risk, include a “Business Impact” statement. For example, “Database latency has increased by 15%, creating a risk of slow checkout times during peak hours.”
- Maintain a Risk & Dependency Log: Specifically track technical dependencies, such as reliance on another team’s API or a third-party service, as these are common points of failure in IT projects.
This detailed approach to reporting is a fundamental part of successful technology delivery. For a deeper dive into the tools and methods for monitoring progress, you can explore effective strategies for project progress tracking from Resolution.de.
5. Financial Services Project Status Report
A Financial Services Project Status Report is a highly specialized format designed to meet the stringent demands of the finance industry. It prioritizes regulatory compliance, detailed risk management, and audit readiness above all else. Unlike standard reports, this format is built to withstand scrutiny from both internal audit teams and external regulators like the SEC or Basel Committee.
This type of report provides an unassailable record of project activities, decisions, and outcomes, focusing on financial metrics, risk exposure, and adherence to legal frameworks. It is essential for projects like technology modernizations at institutions such as JPMorgan Chase or regulatory compliance implementations across the banking sector. The methodology emphasizes traceability and defensibility, ensuring every reported item has a clear audit trail.
Strategic Analysis & Breakdown
The core strength of this report is its function as a risk mitigation and compliance tool. It goes beyond simple progress tracking to provide a detailed assessment of regulatory impact and financial risk. For instance, a change in project scope isn’t just a schedule adjustment; it’s evaluated for its potential effect on Dodd-Frank or GDPR compliance.
Strategic Insight: In financial services, the project status report is not just for stakeholders; it’s a critical piece of evidence for regulators. The primary goal is to demonstrate control, transparency, and due diligence, proving that the project is managed within established risk and compliance guardrails.
These project status report examples often include specific sections for regulatory impact assessments, where any changes are cross-referenced against relevant laws. It tracks both quantitative risks, like budget variances, and qualitative risks, such as potential impacts on the bank’s reputation. This meticulous approach turns the report into a key component of the organization’s governance, risk, and compliance (GRC) framework.
Actionable Takeaways
To implement this report effectively:
- Maintain an Impeccable Audit Trail: Document every significant decision, change request, and risk assessment. Link these records directly within the report to provide instant traceability for auditors and regulators.
- Integrate Regulatory Checkpoints: Build specific milestones into your project plan that correspond to regulatory requirements. Report on the status of these checkpoints explicitly.
- Quantify Risk Exposure: Instead of simply listing risks as “high” or “medium,” assign potential financial impact figures or probability scores. This provides a clearer picture for senior leadership and risk committees.
6. Marketing Campaign Status Report
A Marketing Campaign Status Report is a performance-focused summary tailored for marketing initiatives. It tracks key performance indicators (KPIs), campaign metrics, audience engagement, and return on marketing investment (ROMI). Unlike a general project report, this format emphasizes data-driven insights and clear marketing attribution, directly linking activities to business outcomes like leads, conversions, and revenue.
These reports are essential for demonstrating marketing’s value and are widely used by digital marketing agencies and companies like HubSpot. They translate campaign activities into a language of performance and impact, making them vital for stakeholder alignment. From Nike’s global launch dashboards to political campaign performance reports, the core principle is to connect marketing efforts to measurable results.
Strategic Analysis & Breakdown
The strength of a marketing report is its ability to tell a story with data, showing not just what happened but why. It should segment results by channel, creative, and audience demographics to uncover which strategies are most effective. Including both leading indicators (e.g., click-through rates, engagement) and lagging indicators (e.g., cost per acquisition, customer lifetime value) provides a holistic view of campaign health.
Strategic Insight: A great marketing report moves beyond vanity metrics. Instead of just reporting website traffic, it focuses on conversion rates from that traffic. This shifts the conversation from activity to achievement, proving marketing’s direct contribution to business growth.
Setting up proper tracking and attribution from the very beginning is non-negotiable for these project status report examples. This foundational work ensures every dollar spent and every action taken can be accurately measured. Comparing performance against industry benchmarks or past campaigns provides crucial context, turning raw data into strategic intelligence. The principles behind effective visual reporting are key, and a good report will apply many fundamental dashboard design best practices from Resolution.de.
Actionable Takeaways
To create a powerful marketing campaign report:
- Define Success Metrics First: Before the campaign launches, agree on the primary KPIs with stakeholders. This ensures your report directly answers their most important questions.
- Visualize the Funnel: Use visuals to map the customer journey, from initial awareness (impressions) to final action (conversion). This helps identify bottlenecks and opportunities for optimization.
- Segment for Deeper Insights: Don’t just report overall numbers. Break down performance by audience segment, geographic location, or ad creative to understand what truly resonates.
7. Research and Development Status Report
A Research and Development (R&D) Status Report is a specialized format designed for projects where outcomes are uncertain and the primary goal is discovery, not just delivery. Unlike standard project reports focused on fixed scope and deadlines, this format tracks scientific progress, experimental results, intellectual property milestones, and future commercial potential. It is built to communicate value even when experiments fail, a common and expected part of R&D.
This report type is essential in industries with long, high-risk development cycles, such as pharmaceutical drug development at companies like Pfizer or breakthrough technology initiatives within Google’s research divisions. The methodology, refined by institutions like Bell Labs and IBM Research, balances the need for rigorous scientific documentation with the business-driven demand for progress updates. It acknowledges that learning from a “failed” experiment is a valuable project outcome.
Strategic Analysis & Breakdown
The R&D report’s strength is in its focus on knowledge generation over simple task completion. It frames progress around hypotheses, experiments, and learnings. This allows stakeholders to understand the journey of discovery and the rationale behind pivots or changes in direction, which are common in research settings.
Strategic Insight: This report reframes failure as a data point. By documenting negative results and dead ends, you build a knowledge base that prevents future teams from repeating the same mistakes and informs a more robust, evidence-based project strategy.
For these project status report examples, success is measured by what was learned and its impact on the project’s direction. For instance, a report might show that a particular chemical compound was ineffective, but the reason why it was ineffective unlocks a new, more promising avenue of research. This transparent approach builds trust with sponsors by showing that every investment, successful or not, yields valuable information.
Actionable Takeaways
To implement this report effectively:
- Focus on Learning, Not Just Deliverables: Structure the report around key research questions and hypotheses. Detail the experiments conducted, the results (both positive and negative), and the conclusions drawn.
- Track Intellectual Property (IP) Actively: Include a dedicated section for IP development, such as patent applications, invention disclosures, or key discoveries that could be protected. This directly links research activities to long-term business value.
- Maintain Detailed Experimental Documentation: Ensure that the report references comprehensive lab notes or experimental logs. This provides an audit trail and supports the scientific rigor required for patent filings or regulatory submissions.
7 Project Status Report Examples Compared
| Report Type | Implementation Complexity 🔄 | Resource Requirements ⚡ | Expected Outcomes 📊 | Ideal Use Cases 💡 | Key Advantages ⭐ |
|---|---|---|---|---|---|
| Executive Dashboard Status Report | Medium — requires design and data integration | Moderate — visualization tools and data sources | High-level strategic insights, quick executive decisions | Large enterprises, complex programs, C-suite reporting | Saves time, easy to understand, consistent format |
| Agile Sprint Status Report | Low to Medium — aligns with Agile tools and ceremonies | Low — automated data collection from Agile tools | Iterative delivery, transparency, continuous improvement | Software development teams, iterative projects | Promotes collaboration, quick course correction |
| Construction Project Status Report | High — extensive field data collection and photo documentation | High — requires field personnel and equipment like drones | Detailed safety, progress, and compliance tracking | Construction and infrastructure projects | Addresses industry-specific needs, strong visual proof |
| IT Project Status Report | Medium to High — integration with ITSM and monitoring tools | Moderate to High — technical tools and data feeds | Technical risk management, system performance tracking | IT projects, system implementations, infrastructure | Technical detail focus, supports various methodologies |
| Financial Services Project Status Report | High — extensive documentation and compliance tracking | High — detailed audit and risk management resources | Regulatory compliance, risk mitigation, financial tracking | Banking, fintech, regulatory projects | Meets regulatory needs, emphasizes risk management |
| Marketing Campaign Status Report | Low to Medium — depends on analytics infrastructure | Moderate — analytics and tracking platforms | Data-driven campaign optimization and ROI tracking | Marketing campaigns, product launches, brand initiatives | Clear ROI, supports optimization, easy stakeholder communication |
| Research and Development Status Report | High — requires scientific and business data integration | High — specialized knowledge and long-term tracking | Innovation tracking, research milestones, IP status | Scientific research, product innovation, tech development | Balances science with business, manages uncertainty |
From Example to Execution: Building Your Perfect Report
We’ve journeyed through a diverse collection of project status report examples, from high-level executive dashboards to detailed Agile sprint summaries and industry-specific templates for construction and IT. Each example was more than just a template; it was a strategic communication tool designed for a specific audience and purpose. Moving forward, the goal isn’t to simply copy-paste these formats but to synthesize their best elements into a reporting system that works for you.
The key lesson is that the most effective project status report is not a one-size-fits-all document. It’s a dynamic, audience-aware asset that evolves with your project and your team.
Synthesizing the Core Strategies
As we analyzed the various project status report examples, several core principles emerged as universally critical for success. Mastering these will elevate your reporting from a routine chore to a strategic advantage.
- Audience-Centric Design: The stark contrast between the Executive Dashboard and the Agile Sprint Report highlights the most crucial rule: always build for your audience. Executives need high-level KPIs and risk assessments, while development teams need granular details on blockers and sprint velocity.
- The Power of Visuals: Numbers in a spreadsheet are easy to ignore. The same data presented in a burn-down chart, a Gantt chart progress bar, or a RAG status indicator becomes immediately understandable and impactful. Visuals translate complex data into quick, actionable insights.
- Proactive Risk Management: A status report should do more than document what has already happened. As seen in the IT and Construction examples, its real power lies in proactively identifying and communicating risks, issues, and dependencies before they derail the project.
Strategic Takeaway: Your report’s primary function is to enable decision-making. Every section, metric, and comment should be geared towards giving stakeholders the precise information they need to provide support, remove obstacles, or adjust priorities.
Actionable Next Steps: Crafting Your Custom Report
Now it’s time to transition from theory to practice. Use the insights from the examples we’ve explored to build a report that is perfectly tailored to your project’s unique demands. When you’re ready to move from studying generic examples to building your own tailored report, a solid grasp of effective project management principles is crucial for creating a report that truly drives success.
Follow these steps to get started:
- Identify Your Audience(s): List every stakeholder group that will receive your report (e.g., senior leadership, client contacts, internal team).
- Define Their Needs: For each audience, ask: What do they care about most? What decisions do they need to make based on this report? What level of detail do they require?
- Select Your Key Metrics: Based on audience needs, choose the most relevant KPIs. This could be budget variance for executives, story points completed for a Scrum team, or milestone completion for a client.
- Prototype and Iterate: Draft a report using elements from the project status report examples that best fit your needs. Share this draft with a few key stakeholders and ask for feedback. Be prepared to refine your format based on what proves most useful and clear for them.
By following this process, you create more than just a document; you build a powerful communication engine that fosters alignment, builds trust, and keeps your projects firmly on the path to success.
Ready to supercharge your project management within the Atlassian ecosystem? The innovative apps from resolution Reichert Network Solutions GmbH help you automate workflows and centralize critical information, making it easier than ever to gather the data you need for accurate and impactful status reports. Explore their solutions to see how you can streamline your reporting process.
