
Figuring out how to quickly measure employee satisfaction really comes down to using a smart mix of direct and indirect methods. On one hand, you have your direct approaches like eNPS, pulse surveys, and annual reviews, which give you straightforward feedback. On the other, you can look at indirect signs like absenteeism and turnover rates to get a feel for the underlying sentiment.
Why Measuring Employee Satisfaction Is a Business Imperative

Before we get into the nuts and bolts of specific tools and techniques, it’s vital to grasp why this is a core business function, not just some “feel-good” HR task. Ignoring how your team feels is like trying to steer a ship without a compass. You might be moving, but you have no clue if you’re sailing straight into a storm.
Unhappy employees don’t just quietly clock in and out. Their dissatisfaction sends ripples across the entire organization.
When morale dips, productivity almost always follows. Disengaged employees are far less likely to innovate, collaborate effectively, or put in that extra effort when it counts. This directly eats into your bottom line through missed deadlines, lower-quality work, and a general loss of momentum.
The Real Cost of Disengagement
The economic hit from a checked-out workforce is genuinely staggering. Recent data shows that only about 23% of employees worldwide feel engaged at work. Think about that. The vast majority—62%—are just going through the motions.
This widespread disengagement comes with a massive price tag, with lost productivity estimated at a mind-boggling $8.9 trillion. That’s roughly 9% of the entire global GDP.
This isn’t just some abstract global issue; it’s a daily reality for companies that don’t listen. High turnover, a classic symptom of low satisfaction, forces you to burn precious resources on recruiting and training new people instead of investing in growth.
A proactive approach to measuring satisfaction transforms it from a reactive chore into a strategic advantage. It allows you to anticipate problems, retain top talent, and build a culture where people are motivated to do their best work.
Once you have a handle on where things stand, the next move is to tackle the sources of dissatisfaction. For instance, high levels of workplace stress are a direct drain on morale and productivity. To get some practical ideas on this, check out A Gentle Guide on How to Reduce Workplace Stress.
Core Methods for Measuring Employee Satisfaction at a Glance
There’s no single “best” way to measure satisfaction; the most accurate picture emerges when you combine a few different methods. Each approach offers a unique lens for viewing your organization’s health, highlighting different facets of the employee experience.
Here’s a quick rundown of the most common approaches, breaking down what they’re good for and where they can fall short.
| Method | Best For | Potential Pitfalls |
|---|---|---|
| Annual Surveys | Strategic, deep-dive analysis of long-term trends and company-wide issues. | Can become outdated quickly; data may feel overwhelming if not segmented. |
| Pulse Surveys | Quick, frequent check-ins on specific initiatives or team morale. | Risk of “survey fatigue” if overused; lacks deep contextual detail. |
| One-on-One Meetings | Gaining qualitative, nuanced feedback and building individual trust. | Not easily scalable; success depends heavily on manager-employee dynamics. |
| Indirect Metrics | Identifying hidden issues by analyzing data like absenteeism and turnover. | Provides correlation, not causation; requires careful interpretation. |
By weaving these methods together, you create a robust feedback system that captures both the hard data and the human stories behind the numbers. This holistic view is the foundation for making smart decisions that genuinely improve the employee experience.
Your Toolkit for Gauging Team Morale
Alright, let’s get practical. To really understand how your team is feeling, you need the right set of tools. It’s not about guessing; it’s about collecting real data that gives you a clear, actionable picture of team morale. We’ll start with one of the simplest, yet most powerful, metrics out there.
Decoding the Employee Net Promoter Score
You’ve probably heard of the Employee Net Promoter Score (eNPS). It’s popular for a reason—it’s incredibly straightforward. The whole thing hinges on one key question: “On a scale of 0-10, how likely are you to recommend this company as a place to work?”
The responses immediately sort your team into three groups:
- Promoters (scores of 9-10): These are your champions. They’re loyal, enthusiastic, and genuinely advocate for the company. They’re the ones lifting the culture up.
- Passives (scores of 7-8): This group is content, but not necessarily committed. They’re generally satisfied, but a better offer could easily lure them away. They aren’t actively disengaged, but they aren’t driving engagement either.
- Detractors (scores of 0-6): These are your unhappy employees. Their dissatisfaction can be toxic, spreading negativity and dragging down both morale and productivity.
Calculating your eNPS is just simple math: subtract the percentage of Detractors from the percentage of Promoters. The final score lands somewhere between -100 and +100.
A positive eNPS (anything over 0) is a decent start. A score between 10 and 30 is considered good, and anything above 50 is excellent. But honestly, the most important benchmark is your own trendline. The goal should always be steady improvement.
It also helps to keep an eye on industry averages for context. For example, the average eNPS hit 37 in Q1 2025, which was a small bump from the last quarter. Knowing this tells you if you’re generally on par with the market. You can dig into more recent eNPS trends on bamboohr.com to see how you stack up.
Choosing Your Survey Cadence
Beyond just the eNPS, how often you survey your team is a huge piece of the puzzle. The feedback you get from a quick weekly check-in is going to be very different from a deep annual review. Most companies use a mix of pulse and annual surveys, and each has its own strategic place.
Think of it like this: Different data points come together to create the full picture.
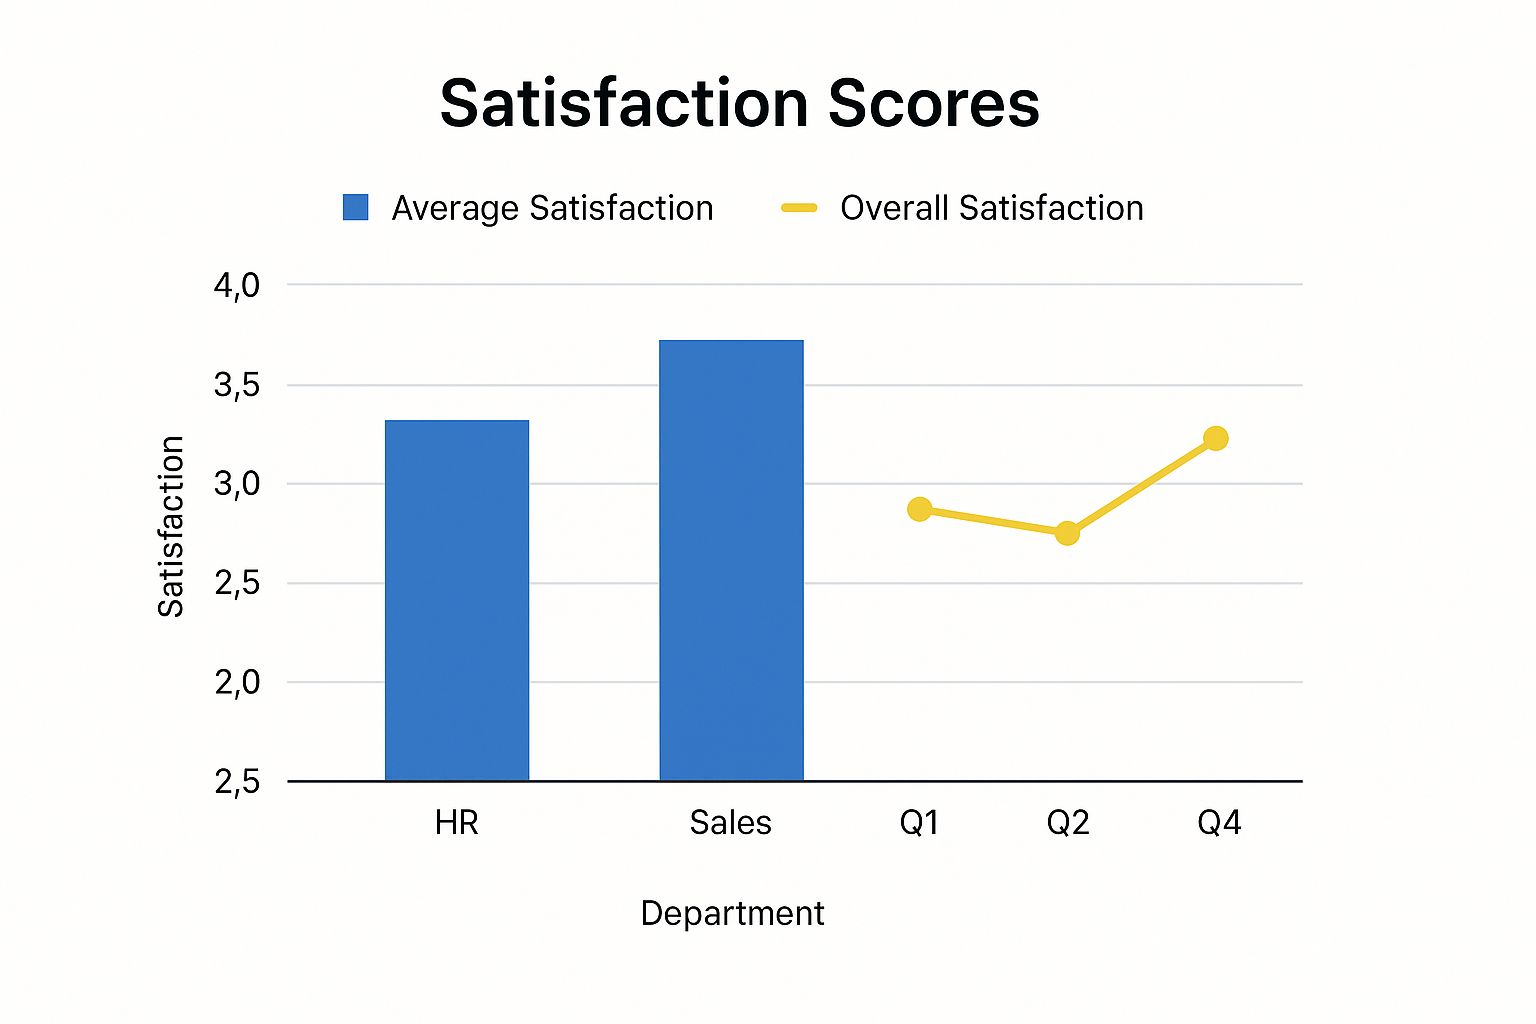
This visual is a great example. It shows that even if overall satisfaction is trending up, a dip in the Engineering department signals that something specific needs your attention there.
To help you decide what works best for your team, let’s compare the three main approaches.
Satisfaction Metrics Compared eNPS vs Pulse vs Annual Surveys
Each survey type serves a different purpose, from quick temperature checks to comprehensive strategic reviews. The key is knowing which one to use and when.
| Metric/Survey Type | Frequency | Primary Goal | Example Question |
|---|---|---|---|
| eNPS Survey | Quarterly or Bi-Annually | Measure overall loyalty and advocacy with a single, standardized metric. | “On a scale of 0-10, how likely are you to recommend our company as a great place to work?” |
| Pulse Survey | Weekly or Monthly | Get a real-time snapshot of sentiment on specific, timely topics (e.g., a recent policy change). | “How manageable has your workload been this past week on a scale of 1-5?” |
| Annual Survey | Annually | Conduct a deep dive into long-term engagement drivers like career growth, leadership, and culture. | “How satisfied are you with the opportunities for professional growth at this company?” |
Using a mix of these ensures you’re not missing anything. You get the high-level loyalty score, the immediate feedback on day-to-day issues, and the deep insights needed for long-term planning.
Pulse Surveys: The Quick Check-In
Think of pulse surveys as a quick, informal “how’s it going?” They are short, frequent (maybe weekly or bi-weekly), and laser-focused on a current topic. Did you just roll out a new software? Is the team feeling the pressure of a looming deadline? A pulse survey is perfect for that.
Because they’re so agile, you can spot and react to issues before they snowball. If you want some solid advice on what to ask, there’s some excellent guidance for building an employee morale survey here.
Annual Surveys: The Strategic Deep Dive
The annual survey is your big, strategic overview. This is where you go deep on everything from compensation and benefits to leadership effectiveness and work-life balance. It’s a comprehensive health check for your entire organization.
The detailed, rich data you get from an annual survey is pure gold for shaping your long-term people strategy. It helps you identify systemic problems, track trends over the years, and make informed decisions about major policy or cultural shifts.
Crafting Questions That Get You Real Answers
Here’s the thing: the data you get is only as good as the questions you ask. If your questions are vague, loaded, or confusing, you’ll get skewed, unhelpful answers. You’re aiming for questions that are crystal clear, specific, and neutral.
It’s easy to get this wrong. Let’s look at a few common mistakes and how to fix them.
| Ineffective Question | Why It Fails | Effective Question |
|---|---|---|
| “Don’t you agree that our new wellness program is great?” | This is a leading question. It’s basically asking for a “yes” and shuts down honest feedback. | “How has the new wellness program impacted your work-life balance?” |
| “Are you happy at work?” | Way too broad. “Happy” means different things to different people, and the answer can change by the hour. | “On a scale of 1-5, how manageable has your workload been this month?” |
| “What do you think about management?” | This is too vague. Are we talking about their direct manager? Senior leadership? Communication style? | “How clearly do you feel your manager communicates expectations?” |
By combining the simplicity of eNPS, the immediacy of pulse surveys, and the depth of annual reviews—all powered by well-crafted questions—you build a powerful system. This approach ensures you’re capturing both the big-picture trends and the subtle, individual experiences that truly define your workplace culture.
Crafting Surveys People Actually Want to Answer

Let’s be honest, we’ve all gotten that mandatory survey notification and immediately thought, “Not this again.” If you’ve felt that way, you can bet your employees have too.
The trick is to design a survey that feels less like a corporate mandate and more like a real conversation. It should be a genuine opportunity for your team to be heard without any fear of judgment.
The single most critical element to get right? Guaranteed anonymity. If your team suspects their answers can be traced back to them, you’ll never get truly honest feedback. This isn’t just a promise you make once; it needs to be communicated clearly before, during, and after the survey goes out.
Balancing Numbers with Narratives
To really get a pulse on employee satisfaction, you need a smart mix of question types. Think of it as collecting both the “what” and the “why.” Each format serves a specific purpose, and together, they paint a complete picture of your workplace sentiment.
You’ll mainly be working with two kinds of questions:
- Quantitative Questions: These are your numbers-driven questions. They often use a Likert scale (e.g., “On a scale of 1 to 5, how satisfied are you…”) or multiple-choice formats. Their real value is giving you clean, benchmarkable data that’s easy to track over time.
- Qualitative Questions: These are the open-ended questions that invite stories and detailed responses (e.g., “What is one thing we could do to improve our team meetings?”). This is where you uncover the context, emotion, and specific examples behind the scores.
A survey with only numbers tells you that a problem exists. But adding qualitative questions helps you understand why it exists. The real magic happens when you use both.
Your quantitative data identifies the smoke, but your qualitative feedback leads you to the fire. Ignoring open-ended responses means you’re missing the most actionable insights your employees are offering.
The Pre-Flight Checklist for Survey Design
Before you even think about hitting “send,” run your survey through a quick quality check. A poorly designed survey doesn’t just give you bad data; it actively erodes trust and makes people less likely to participate next time. It screams, “We don’t value your time.”
Here are a few critical points to look over:
- Avoid Leading Questions: Never phrase a question in a way that hints at the answer you want. Instead of, “Don’t you agree our new communication tool is a big improvement?” ask, “How has the new communication tool affected your workflow?”
- Cut the Corporate Jargon: Use simple, clear language that everyone gets. Terms that seem obvious in the C-suite might be confusing to a new hire or someone in a completely different department.
- Keep It Concise and Mobile-Friendly: Respect your employees’ time. Any survey that takes more than 10-15 minutes will see a major drop-off in completion rates and the quality of the answers. Always check how it looks and works on a phone, because that’s where many people will take it.
Examples of Strong Survey Questions
Getting the phrasing right is everything. A well-worded question is specific, neutral, and focuses on a single topic, which is how you get feedback you can actually use.
Here’s a look at how to structure questions for different areas:
| Category | Strong Question Example | What It Measures |
|---|---|---|
| Workload & Balance | “On a scale of 1 to 5, how manageable has your workload been over the past month?” | Burnout risk and resource allocation. |
| Management Support | “How confident are you that your manager has your back when issues arise?” | Psychological safety and trust in leadership. |
| Team Collaboration | “How easy is it to get the information you need from other team members to do your job?” | Efficiency of internal communication and teamwork. |
| Career Growth | “Do you see a clear path for career advancement for yourself at this company?” | Long-term retention and development opportunities. |
Crafting a great survey is a blend of art and science. By focusing on trust, clarity, and a solid mix of question types, you create a powerful tool for listening. This foundation is essential for improving how your team works together. For more on that, you can check out our guide on how to improve team collaboration, which offers practical steps that can be informed by what you learn from your survey.
Listening Beyond the Survey Form
While a solid survey gives you invaluable quantitative data, some of the richest insights into how your team really feels are found in the day-to-day chatter and behavioral shifts around the office. To truly get the pulse of your organization, you have to tune into these signals. They reveal the emotional texture that raw numbers just can’t capture.
The most honest feedback doesn’t come from a formal questionnaire. It comes when people feel psychologically safe enough to speak their minds. This means shifting your mindset from periodically asking to constantly listening.
Turning One-on-Ones into Listening Sessions
Your routine one-on-one meetings are a goldmine for candid feedback, but only if you treat them as genuine listening sessions instead of just another status update. As a manager, your job is to create a space where your team members feel comfortable sharing their frustrations, ambitions, and observations without fearing any blowback.
Instead of the generic “How are things going?”, try digging a bit deeper with open-ended questions that invite real conversation:
- “What’s one thing we could change about our team meetings to make them more effective for you?”
- “When did you last feel energized and proud of your work here? What were you doing?”
- “Are there any roadblocks or bits of friction in your daily work that I could help remove?”
These kinds of questions get you stories, not just one-word answers. They transform a routine check-in into a powerful, ongoing tool for measuring satisfaction on a personal level. Make sure to actually listen, take notes, and follow up—it shows their feedback isn’t just disappearing into the void.
The goal of a one-on-one isn’t just to track project progress; it’s to track a person’s professional and emotional journey within the company. When you treat these conversations with that level of importance, you unlock a continuous stream of honest feedback.
Decoding the Stories in Your Lagging Indicators
Some HR metrics are like footprints in the snow—they tell you where someone has been and hint at why they left. While surveys act as leading indicators of future behavior, data points like turnover and absenteeism are lagging indicators. They reflect dissatisfaction that has already happened.
- Exit Interviews: Don’t just go through the motions here. The feedback from a departing employee is often the most unfiltered you’ll ever get. Look for patterns. If multiple people mention a lack of growth opportunities or issues with a specific manager, you’ve got a clear signal of a systemic problem.
- Absenteeism Trends: A sudden spike in unplanned absences on a particular team is rarely just a scheduling headache. It can be an early warning sign of burnout, low morale, or a conflict that’s simmering just below the surface.
- Employee Turnover Rates: High turnover is the ultimate lagging indicator that something is fundamentally broken. Analyzing this data by department, manager, or even tenure can pinpoint the exact hotspots where the employee experience is failing. Diving into different techniques for measuring team morale can give you a more structured way to interpret these trends.
The Unfiltered Pulse of Internal Communications
Your internal comms channels, like Slack or Microsoft Teams, are a living, breathing record of your company culture and morale. While respecting privacy is non-negotiable, analyzing public channels for general sentiment offers a real-time, unfiltered pulse on how people are feeling.
Sentiment analysis tools can scan public channels for keywords and emotional tone, flagging potential issues or celebrating positive interactions. Is the tone in the #engineering channel collaborative or tense? Are people dropping celebratory emojis, or is the conversation strictly transactional? This kind of ambient data provides a much more holistic—and often more accurate—picture of employee satisfaction.
Interestingly, this connects to a broader trend. ManpowerGroup’s Global Talent Barometer 2025 found that while 89% of workers feel confident in their skills, only 62% are satisfied with their jobs. This gap shows that even highly capable people can become disengaged if their daily workplace experience falls short. You can learn more about these global talent trends on manpowergroup.com.
Turning Your Data Into Meaningful Action

Collecting feedback is actually the easy part. The real work—and the real value—begins when you transform that raw data from a spreadsheet of numbers into a clear, actionable story about your organization.
Let’s be honest: data without action is just noise. This is the moment where measurement truly becomes management.
Your first move is to find the patterns. Instead of getting bogged down in individual comments, look for the recurring themes. Are multiple people mentioning a lack of recognition? Is workload a constant refrain in the feedback from a specific department? This is how you find the signal in the noise.
Segmenting Your Data to Find the Source
An overall company satisfaction score is a fine starting point, but it often hides the most critical details. The real breakthroughs happen when you start slicing the data into smaller, more specific segments. This is how you pinpoint exactly where problems—and successes—are happening.
Think about breaking down your results by these key demographics:
- Department: Is the engineering team thriving while the sales team is struggling? Department-level analysis can uncover management styles or process issues that are siloed in one area.
- Role or Level: Do junior employees feel disconnected from the company mission, while senior staff feel highly engaged? This can shine a light on gaps in your onboarding or career development paths.
- Tenure: Are your newest hires enthusiastic, but satisfaction plummets after the two-year mark? This is a classic sign that the reality of the job isn’t matching the promises made during recruitment.
By digging into these segments, you can shift from a vague problem like “company morale is low” to a specific, solvable issue like “our mid-level managers in the marketing department need better training on giving constructive feedback.” That kind of precision is what leads to real change.
Don’t treat your employee feedback as one monolithic block of information. The most valuable insights are almost always found by comparing the experiences of different groups within your organization. Averages hide the outliers, and the outliers often tell the most important stories.
Closing the Feedback Loop with Transparency
You’ve analyzed the data and pulled out the key themes. Now comes the most crucial step of all: closing the loop.
If your team offers their time and honesty but never hears anything back, you’ve broken their trust. They’ll assume their feedback went into a black hole, and you can bet participation in the next survey will drop.
Sharing the results—both the good and the bad—is non-negotiable. This transparency shows respect for your team’s input and proves that leadership is actually listening.
Your communication plan should have a few key parts:
- Acknowledge and Thank: Kick things off by thanking everyone for participating. Share the overall response rate to show it was a collective effort.
- Share High-Level Themes: Present the main takeaways. Celebrate the wins and own the areas that need work. For example, you might say, “We scored highly on team collaboration, which is fantastic. However, we also saw a clear theme around the need for better career pathing.”
- Outline Concrete Next Steps: This is the most important part. Announce one or two specific, tangible actions you’ll take based on the feedback. Avoid vague promises. Instead of “we’ll work on communication,” say “we’re launching a task force to fix our cross-departmental meeting structure, and we’ll have an update in 60 days.”
Inefficient meetings are often at the root of communication breakdowns. If that’s a theme for you, you can find practical advice on how to improve meeting effectiveness in our guide.
This cycle of listening, analyzing, sharing, and acting is what builds a culture of continuous improvement. It proves that feedback isn’t just a corporate exercise—it’s a vital part of how the company grows.
A Real-World Case Study
Think about a mid-sized tech company that saw its eNPS score drop by 15 points in six months. The overall score didn’t tell them much. But when they segmented the data, they found the drop was almost entirely concentrated within their remote workforce.
Digging into the comments, they discovered a recurring theme: remote employees felt invisible. They were missing out on the spontaneous “hallway conversations” that sparked new project opportunities and felt their contributions were overlooked compared to their in-office colleagues.
Instead of just promising to “improve communication,” the leadership team took two specific actions. First, they mandated that all major team meetings become “remote-first,” meaning everyone joined via video call to level the playing field. Second, they rolled out a new digital recognition tool in their company chat to publicly celebrate wins from all employees, regardless of location.
Just three months later, their follow-up pulse survey showed a huge rebound in satisfaction among remote workers. This small, focused intervention—driven entirely by segmented data—fixed a real problem and proved to the whole company that their voices were being heard. That’s the power of turning data into meaningful action.
Common Questions About Employee Satisfaction
Even with the best intentions and the right tools, you’re bound to run into questions when you start measuring employee satisfaction. It’s a nuanced process, and hitting a few bumps is completely normal.
Let’s walk through some of the most common questions leaders ask. These are the quick, practical answers you need to clear up any confusion and move forward with confidence.
How Often Should We Measure Employee Satisfaction
Finding the right survey rhythm is everything. You need useful data, but you don’t want to burn out your team. A balanced, two-pronged approach almost always wins.
First, think about a comprehensive, deep-dive survey done annually. This is your big-picture tool for strategic planning. Use it to dig into the long-term drivers of satisfaction, like career growth opportunities, compensation, and the overall company culture.
Then, sprinkle in lighter, more frequent pulse surveys. Sending these out quarterly or even monthly is a great way to track progress on specific initiatives. It helps you catch emerging issues before they snowball into major problems. This combination gets you the data you need without causing “survey fatigue.”
The golden rule, no matter the frequency, is to act on what you learn. When people see that their feedback actually leads to tangible changes, they’ll trust the process and stay engaged for the next one.
What Should I Do with Overwhelmingly Negative Feedback
Okay, first—take a deep breath. See this for what it is: a gift. It means your team trusts you enough to be honest, even when the truth is tough to hear. The worst thing you can do now is go silent or get defensive.
Acknowledge the results. Do it transparently and do it quickly. Thank everyone for their honesty and then lay out a clear, focused plan for how you’ll start tackling the top one or two concerns. You don’t have to fix everything overnight.
An incredibly powerful next step is to involve your team in brainstorming the solutions. This shows you’re not just listening—you’re genuinely committed to making things better, together. It’s a huge trust-builder.
How Do We Get More People to Complete Surveys
Low participation is almost never about laziness. It’s usually a symptom of a deeper problem. Most of the time, it signals a lack of trust in anonymity or a strong belief that filling out surveys is a waste of time because nothing ever changes.
To turn this around, you have to rebuild that trust.
- Shout Anonymity from the Rooftops: Be crystal clear about how the data is collected, who sees it, and how it’s anonymized. If you need to, use a third-party tool to drive the point home.
- Explain the “Why”: Don’t just ask for feedback; explain what it’s for. Connect the survey directly to tangible improvements, whether that’s refining benefits, improving workflows, or investing in new tools.
- Show, Don’t Just Tell: This is the big one. Share the results and, more importantly, the action plan from the last survey. When people see their voice leads to real, visible change, participation numbers will soar.
What Is a Good Employee Net Promoter Score
This is one of those questions where the answer is, “it depends.” Context is everything. While an eNPS score between 10 and 30 is generally seen as “good” and anything 50 or above is considered “excellent,” these are just benchmarks.
Honestly, the most important comparison is against your own previous score. Your real goal should be continuous improvement. Seeing your score jump from 5 to 15 is a massive win, even if 15 isn’t a “world-class” number on its own.
While checking your score against industry averages can add some helpful context, don’t get obsessed. Focusing on your own upward trend is far more valuable than chasing an arbitrary number. To get a more complete picture, you can explore a wide range of team engagement metrics in our detailed guide.
Turn your team meetings from simple status updates into powerful engagement sessions with resolution Reichert Network Solutions GmbH. Our NASA app for Jira streamlines agile meetings, captures real-time sentiment, and gives you the data you need to act on feedback immediately. Discover how to foster open communication and continuous improvement by trying NASA – Not Another Standup App today.
