
A project status report is more than just a document; it’s a snapshot of your project’s health, covering everything from progress and budget to potential risks. Think of it as the primary tool for keeping everyone, from your core team to the C-suite, on the same page and fully informed.
Why Your Status Report Is a Strategic Tool

Let’s be honest—for many of us, creating a project status report feels like a tedious chore. It’s easy to see it as just another box to tick, a document that gets a quick skim before being filed away forever. But that perspective misses the report’s real power. When you craft it thoughtfully, a status report stops being a simple update and becomes a strategic asset for leading your project.
It’s the narrative of your project’s journey. It doesn’t just list what got done; it tells a story of wins, roadblocks, and the path forward. This document is your first line of defense against the silent killers of project success: miscommunication, scope creep, and stakeholder misalignment.
Creating a Single Source of Truth
Without a recurring, centralized update, project information scatters. Team members might have one version of reality, while executives are working off another. A consistent project status report cuts through that noise and establishes a single, undisputed source of truth.
This clarity brings a few major benefits:
- Aligns Stakeholders: Everyone, from your boots-on-the-ground team to leadership, is working from the same information. This ensures decisions are based on solid data, not guesswork.
- Manages Expectations: It openly communicates where things stand against the timeline and budget, which helps prevent those awkward, surprise conversations down the line.
- Builds Trust: When you share both successes and challenges openly, you foster a culture of accountability and build real confidence among stakeholders.
A 2025 industry analysis found that 31% of companies point to miscommunication about project objectives as the main reason projects fail. And with modern projects being so collaborative—where 90% involve team efforts—clear, consistent communication through these reports is absolutely critical. You can explore additional insights on the strategic role of status reporting to learn more.
Enabling Proactive Risk Management
Maybe the most important strategic role of a project status report is how it enables proactive risk management. It’s not just about reporting what’s already happened; it’s about looking ahead and anticipating what could happen next.
A great status report doesn’t just answer “What did we do?” It forces you to answer “What’s stopping us from succeeding?” This forward-looking perspective is what separates a routine update from a powerful management tool.
By consistently documenting potential risks, roadblocks, and dependencies, you create a formal channel to escalate issues before they derail the entire project. Instead of just reacting to crises, you start to identify patterns, allocate resources to emerging problems, and adjust the plan with agility.
Suddenly, that dreaded obligation becomes your most valuable asset for ensuring project clarity and, ultimately, success.
Building the Core of Your Report
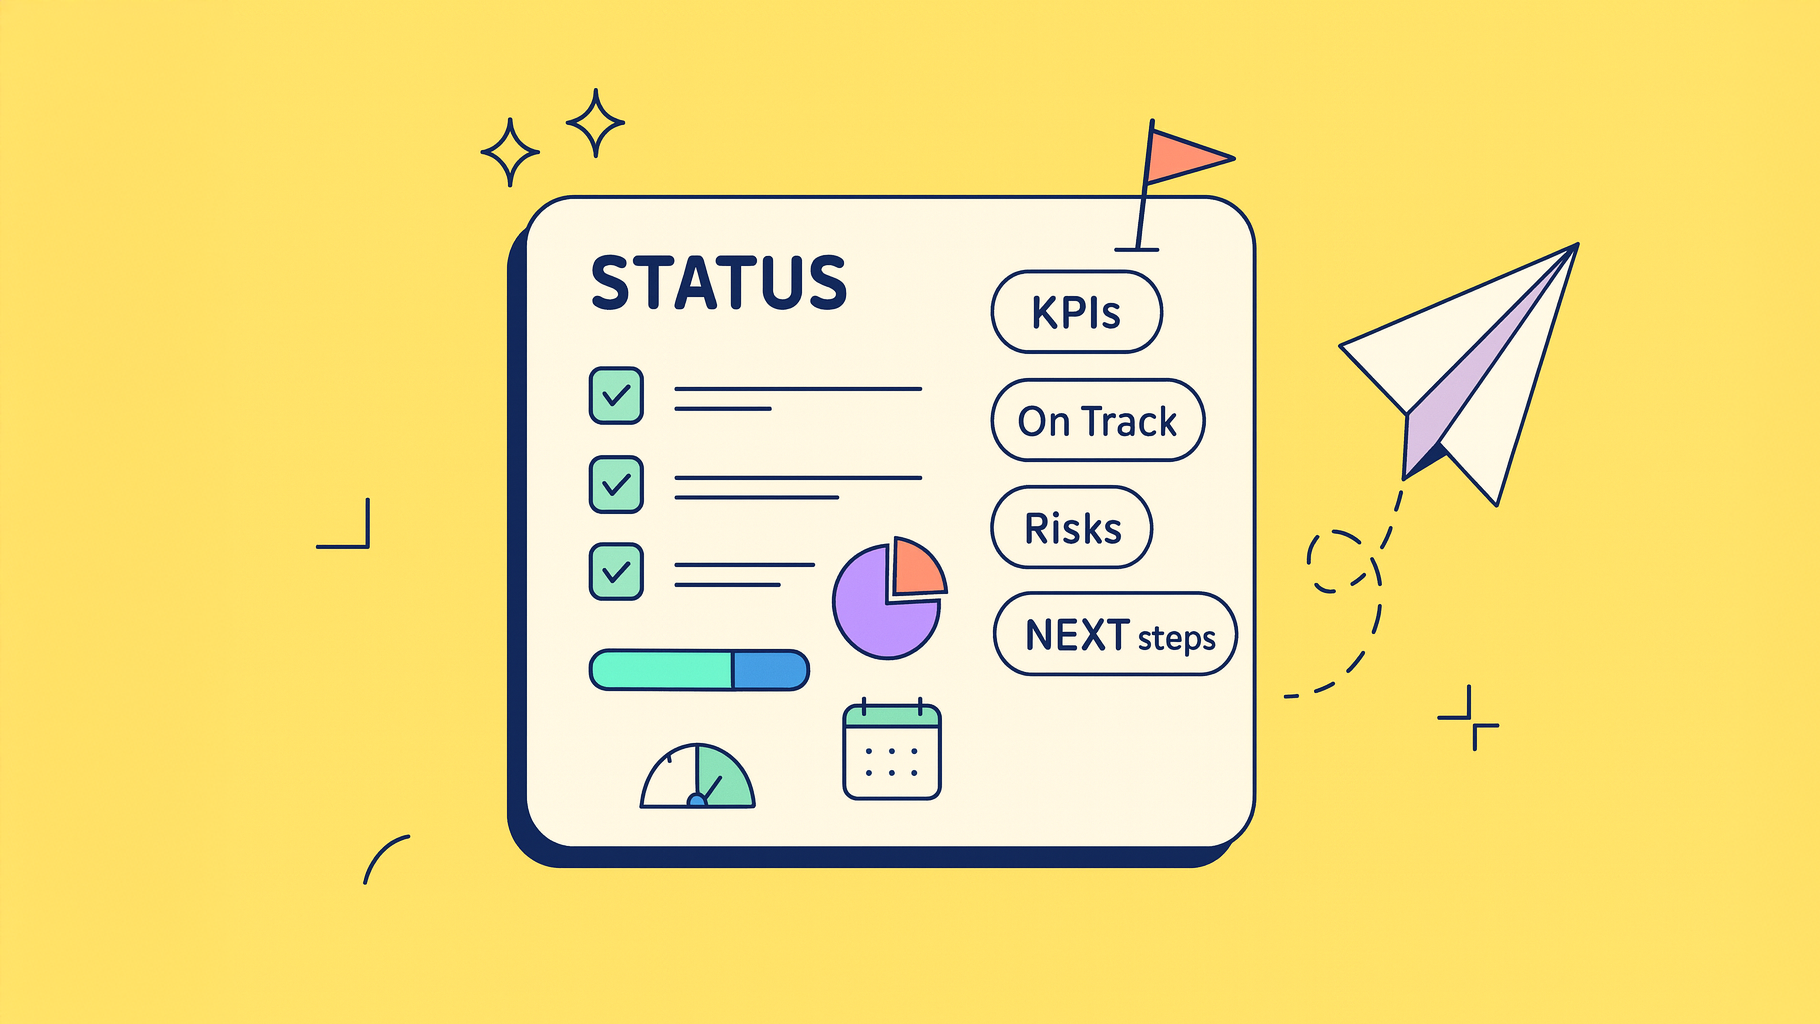
A powerful project status report isn’t just a random brain dump of updates; it’s a structured story built on a few essential pillars. Each piece has a specific job, from giving a high-level snapshot for busy execs to detailing the nitty-gritty for the project team. Getting these core sections right is the first step toward a report that actually informs, aligns, and pushes the project forward.
Think of this as the blueprint for a report that leaves no room for confusion. It’s about moving past generic labels and truly understanding the “why” behind each part of the document.
The Executive Summary for Leaders
Let’s be real: your report will land in front of people who are short on time. The Executive Summary is their lifeline. This should be a tight, three-to-four sentence paragraph right at the top that gives them the complete picture of the project’s health.
It needs to immediately answer the big questions:
- Is the project on track, at risk, or off track?
- What were the biggest wins since the last update?
- Are there any critical blockers that need their attention now?
Treat it like the entire report distilled into a single, digestible shot of information. A stakeholder should be able to read just this section and walk away knowing exactly where things stand.
To make sure your report has all the crucial elements, let’s quickly break down the key components every effective status update should include.
| Component | Purpose | Key Information to Include |
|---|---|---|
| Executive Summary | Provides a high-level overview for stakeholders with limited time. | Overall project status (e.g., On Track, At Risk), major achievements, and critical blockers requiring attention. |
| Progress & Metrics | Shows tangible progress against the project plan using data. | Key performance indicators (KPIs), percentage of completion for milestones, budget vs. actuals, and visual charts. |
| Risks & Issues | Transparently documents current and potential roadblocks. | A clear description of the risk, its potential impact on the project, and the proposed mitigation or resolution plan. |
| Next Steps & Action Items | Outlines the immediate priorities and assigns clear ownership. | Specific, actionable tasks for the upcoming period, who is responsible for each, and their due dates. |
Having this structure in place ensures clarity and consistency, making your reports predictable and easy for everyone to follow.
Progress and Performance Metrics
This is where you back up your summary with cold, hard data. Vague statements like “we made good progress” are pretty useless. What you need are concrete metrics that track performance against the original project plan. This section should be visual and easy to scan.
The infographic below, for example, visualizes the completion rates for our main project objectives, showing exactly where we’re ahead and where we might be slipping.
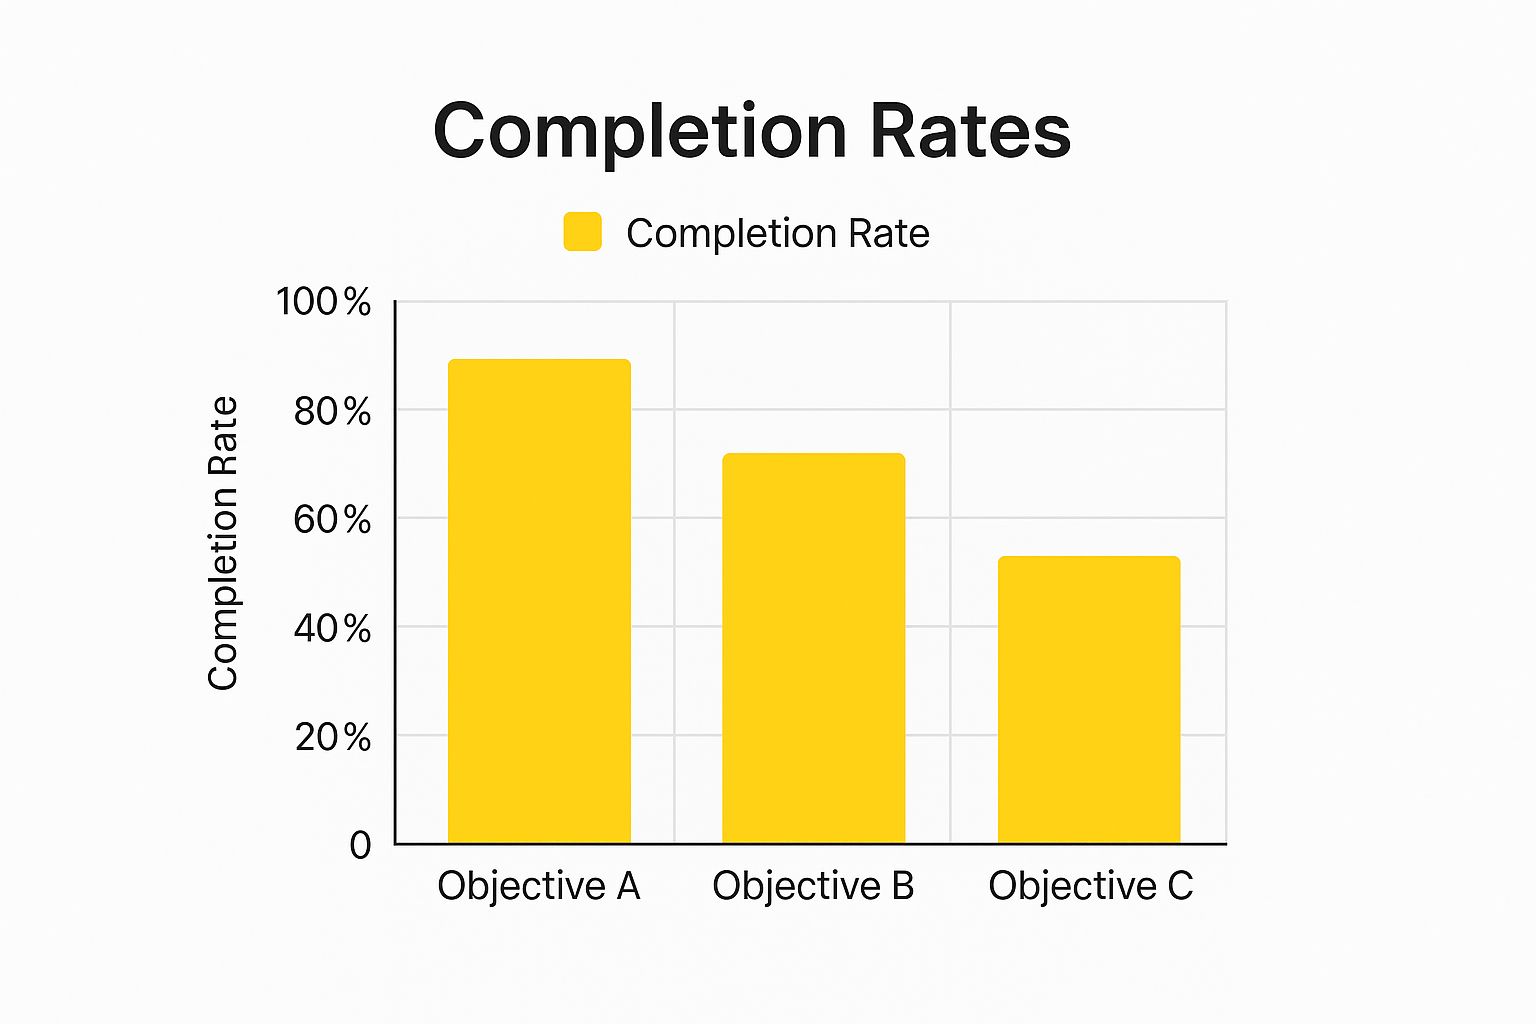
This chart makes it obvious that while Objective A is almost done, Objective C is falling way behind and needs immediate focus. For more ideas on how to structure these updates, you can check out our guide to creating a project status report template.
Risks and Issues
Every project hits speed bumps. Hiding them doesn’t make them disappear—it just guarantees they’ll cause a bigger mess later. This section is where you get honest and transparent about the challenges.
I’ve seen so many reports where people just list their problems. The real pro move is to not only identify a risk but also propose a mitigation plan. This shows stakeholders you’re in control, not just reporting a crisis.
Frame each issue with its potential impact and the proactive steps you’re taking to tackle it. This instantly turns a laundry list of problems into a powerful demonstration of effective project management.
Next Steps and Action Items
Finally, every good status report has to look ahead. This section clearly lays out the immediate priorities and assigns ownership. Don’t just list tasks; define clear action items. Who is doing what, and by when?
This creates accountability and makes sure the momentum from one reporting period rolls right into the next. It closes the loop, transforming your report from a passive update into an active tool that actually drives the project forward.
Choosing the Right Tools for Modern Reporting

Let’s be honest: lengthy email chains and static, outdated spreadsheets are relics of a bygone era in project management. Today’s projects move too fast for that. A modern project status report can’t be a historical document; it needs to be a live pulse check on your project’s health.
This is where dedicated project management software really shines. These platforms are built to automate and elevate the entire reporting process, freeing up teams from the drudgery of manual data entry to focus on dynamic, automated updates.
From Static Spreadsheets to Live Dashboards
The real game-changer with modern tools is their ability to generate reports automatically. Platforms like Jira and Trello pull data directly from the tasks your team is already working on. This means your reports are always built on live information, not on data that was painstakingly compiled hours—or even days—ago.
The impact on accuracy and efficiency is huge. Instead of chasing down updates, project managers can set up dashboards that instantly visualize progress, risks, and resource allocation.
The real power here isn’t just saving time on creating reports. It’s about establishing a single source of truth that every stakeholder can access, which dramatically cuts down on miscommunication and gets everyone aligned around the same data.
Even with these advancements, project management faces serious hurdles. A startling 70% of projects globally fail to hit their targets. A big reason for this is a disconnect in tooling and access to data. While studies show 77% of high-performing projects use specialized software, over 55% of organizations still don’t have access to real-time performance indicators.
This data paints a clear picture: the tide is turning away from spreadsheets and toward more powerful platforms like Microsoft Project, Jira, and Trello.
Selecting the Right Platform for Your Team
Picking a tool isn’t a one-size-fits-all affair. The best platform for you depends entirely on your team’s size, the complexity of your workflow, and the tech stack you’re already using.
When you’re evaluating options, think about these factors:
- Team Size and Complexity: A small team with a straightforward workflow might love a visual tool like Trello. But larger, more complex projects—especially in software development—often need the robust features of Jira for detailed tracking and reporting.
- Integration Capabilities: How well does the tool play with others? Seamless connections to software you use daily, like Slack or Confluence, are critical for a frictionless reporting process.
- Reporting Customization: Can you easily create different reports for different audiences? A great tool lets you build a high-level executive dashboard and a granular, task-focused report for your team, all from the same data set.
Adopting the right software is a massive step forward, but it has to be paired with solid project management practices to be truly effective. Check out our guide on the top project management best practices to make sure your team’s processes are as sharp as your tools.
Ultimately, the goal is to make your reporting process efficient, accurate, and—most importantly—a true driver of project success.
Writing and Delivering Reports That Get Read
Let’s be honest. Pouring hours into a project status report only to have it sit unread in someone’s inbox is beyond frustrating. All that accurate data, all those carefully tracked metrics—it’s a wasted effort if no one reads, understands, or acts on it.
The real challenge isn’t just gathering the information; it’s framing and delivering it in a way that cuts through the noise. This is where you shift from being a data-dumper to a storyteller, turning your updates into communication tools that people actually want to read.
Tailor Your Message to the Audience
Not everyone on your stakeholder list needs the same firehose of information. The CEO definitely doesn’t care about a line-by-line breakdown of every single task, but you can bet your engineering lead does. Sending a one-size-fits-all report is the fastest way to get it ignored.
Instead, think in tiers:
- For Executives: Start with a high-level executive summary. Keep the language simple and non-technical. They need the big picture: overall project health, budget status, and any major roadblocks that require their intervention.
- For Project Teams: This is where you get into the weeds. Provide granular details, task-level updates, technical challenges, and the specific action items everyone needs for the week ahead.
- For Clients: Your focus here should be on progress against the milestones they care about. Frame everything in terms of how it impacts their business goals, sticking to outcomes rather than your internal team processes.
I’ve found that adding a simple “Key Takeaways” section at the very top of a report—customized for each audience—can boost readership by over 50%. It’s a small change that shows you respect their time and gets straight to the point.
The Power of Concise Writing and Visuals
Clarity is everything. Ditch the jargon and complex language. Short sentences and even shorter paragraphs are your best friends here. They make your report scannable and much easier to digest, which is a lifesaver for busy stakeholders.
Then, break up all that text with visuals that tell a story at a glance. A clean chart or graph can communicate budget spend or resource allocation way more effectively than a dense paragraph ever could. Think of visuals as the headlines of your report; they grab attention and make the key takeaways instantly clear.
For a deeper dive into structuring these updates effectively, check out our comprehensive guide on project progress reporting.
Establish a Consistent Delivery Cadence
Consistency is the bedrock of trust. Whether you decide on daily, weekly, or bi-weekly reports, stick to the schedule. When stakeholders know exactly when to expect your project status report, it becomes a reliable part of their routine, not just another random email cluttering their inbox.
Pick a delivery channel that’s simple and accessible for everyone. A shared Confluence page, a dedicated Slack channel, or an automated email from your project management tool can all work wonders. The goal is to make the report easy to find and reference. This predictable rhythm transforms your report from just another update into an anticipated—and valuable—project ritual.
Automating Jira Status Reports with NASA
If your team lives and breathes in the Atlassian ecosystem, you know the grind of manually piecing together a project status report. It’s a thankless, time-sucking task. You’re constantly pulling data from dozens of Jira issues, bugging team members for updates, and wrestling with formatting to make it all look consistent.
This is exactly where automation becomes a game-changer. It’s not just about saving a few hours—it’s about getting more accurate and reliable reports, every single time.
Resolution’s NASA (Narrative Automated Status Aggregator) app was built to solve this exact headache. It plugs right into your Jira projects, automating the collection of progress updates, key milestones, and those crucial qualitative insights from your team. This cuts out the tedious manual work that so often leads to mistakes or stale information, making sure your reports are always based on what’s happening right now.
Streamlining Data Collection in Jira
The real magic of NASA is that it centralizes the entire reporting process inside the tool your team already uses all day, every day. Forget exporting data to spreadsheets or copy-pasting updates into a separate document. The app handles it all automatically.
What you get is a seamless, auditable history of project progress, right where the actual work is getting done.
This image shows the NASA interface right inside Jira, where you can configure and see all the aggregated status updates in one place.

The interface gives project managers a clean, consolidated view to quickly review everyone’s contributions and generate a full report without ever leaving the Jira dashboard.
Configuring and Scheduling Your Reports
Real automation isn’t just about pulling data; it’s about delivering the final report without you having to lift a finger. With NASA, you can build custom report templates for different audiences. Maybe a high-level summary for the execs and a granular breakdown for the project team. If you need some ideas on what to include, our weekly project status update template is a great starting point.
Once your template is set, you can put delivery on autopilot. Just imagine: your weekly status report gets generated and sent to every stakeholder at 4 PM every Friday, like clockwork. This builds a reliable communication rhythm that keeps everyone in the loop without adding to your workload.
When you automate the reporting process, your job shifts from data gathering to data analysis. Instead of burning hours compiling information, you can spend that time spotting trends, tackling risks, and making smart decisions based on what the report is telling you.
This approach brings some serious benefits to the table:
- Enhanced Accuracy: Reports are built directly from Jira issues, slashing the risk of human error.
- Time Savings: It frees up a ton of time for project managers and the rest of the team.
- Improved Consistency: Every report follows the same format, making them easy to read and compare.
- Greater Transparency: It creates a single source of truth for project progress that anyone can access.
Common Questions About Project Status Reports
Even the most seasoned project managers get tripped up by the details of a project status report. Getting the little things right—like how often to send it, who gets a copy, and the right tone—can mean the difference between a report that drives action and one that gets deleted on sight. Let’s tackle some of the most common questions I hear.
One of the first things people ask is how often they should be sending these things out. While there’s no magic number, the real key is consistency.
How Often Should I Send a Report?
The perfect rhythm really depends on your project’s complexity, its timeline, and what your stakeholders expect. For most projects that are moving at a decent clip, a weekly report is the gold standard. This keeps everyone in the loop without drowning them in updates.
If you’re on a longer, more stable project, switching to a bi-weekly cadence might make more sense. The most important thing is to set that schedule during the project kickoff and stick to it. It builds a reliable communication habit that your stakeholders will appreciate.
What Is the Difference Between a Status Report and a Project Plan?
This is a really important distinction. Think of the project plan as your blueprint. It’s a mostly static, forward-looking document you create at the very beginning that outlines the scope, goals, and timeline. It’s your map.
A project status report, on the other hand, is your GPS. It’s a recurring, backward-looking check-in that measures where you actually are against that original blueprint. It answers the crucial question: “Are we where we planned to be?”
When you’re dealing with a project delay, be direct, transparent, and solution-oriented. State the problem and its impact, but immediately follow up with a clear action plan. This shows you’re actively managing the situation, not just flagging a crisis.
The increasing complexity of modern projects has fueled a massive shift toward specialized software. The project management software market is expected to grow from $7.24 billion in 2025 to $12.02 billion by 2030. In fact, a whopping 82% of companies already use these tools to manage their workflows, with many employees noticing a rise in the number of platforms they use. You can discover more insights about the growth of project management software and its impact on reporting.
Who Should Receive the Report?
Your distribution list should include anyone with a real stake in the project’s outcome. Don’t just blast it to everyone. Be strategic.
Your core list will usually include:
- The project sponsor and key executives
- The client or primary customer
- The core project team members
- Functional managers of your team members
Here’s a pro tip: consider creating a couple of versions. A high-level, one-page summary is perfect for busy executives, while a more detailed version works best for the hands-on project team. This ensures everyone gets the right level of information without the noise. And if you’re nearing the finish line, our guide on creating a project handover template is a great resource for making sure that final transition is seamless.
Ready to stop chasing updates and start automating your Jira reporting? resolution’s NASA app streamlines the entire process, building accurate, consistent reports without the manual effort. Discover how NASA can transform your project communication by visiting https://www.resolution.de/nasa.
