
Getting Started
Agile team metrics provide crucial insights into team performance, helping identify areas for improvement and optimize workflows. This listicle presents a curated collection of essential agile team metrics that go beyond the basics, offering actionable strategies for implementation and analysis. Whether you’re a seasoned Scrum Master or a new Agile Coach, understanding these metrics is key to driving successful projects.
This deep dive explores eight essential agile team metrics, equipping you with the knowledge to:**
- Accurately measure team performance: Understand how to use data-driven insights to enhance team effectiveness.
- Identify bottlenecks and roadblocks: Pinpoint areas hindering progress and develop targeted solutions.
- Boost predictability and planning: Improve forecasting and planning by leveraging historical data trends.
- Promote continuous improvement: Foster a culture of data-driven decision-making and iterative progress.
Agile team metrics are essential for adapting to change and fostering a culture of continuous improvement. By tracking metrics such as velocity, lead time, and team happiness, agile teams can quickly identify roadblocks, optimize workflows, and improve predictability. This list helps you understand not just what to measure, but why and how, empowering your team to deliver higher quality work, faster. We’ll cover key metrics including Velocity, Burndown Charts, Lead Time, Cycle Time, Cumulative Flow Diagram (CFD), Escaped Defects, Team Happiness Index, and Definition of Done Compliance. Dive in to discover how these metrics can unlock your team’s full agile potential.
1. Velocity
Velocity is a key agile team metric used to measure the amount of work completed during a sprint. It’s typically measured in story points, hours, or the number of user stories finished. This metric acts as a powerful capacity planning tool, enabling teams to predict future sprint deliverables and refine their estimation accuracy over time. By understanding their velocity, teams can make more informed decisions about sprint planning and workload management. This helps avoid overcommitting and improves the chances of delivering on sprint goals. Velocity provides a stable foundation for predictable sprint planning, contributing to consistent progress.

Examples of Velocity in Action
Several leading tech companies leverage velocity as a planning tool within their agile frameworks. Spotify, for example, uses velocity for capacity planning while explicitly emphasizing that it’s not a performance metric. Microsoft teams often track velocity alongside quality metrics to ensure a balanced delivery approach focusing on both speed and quality. Netflix, known for its data-driven culture, focuses on analyzing velocity trends rather than fixating on absolute velocity numbers, providing a more nuanced understanding of team performance over time.
Practical Tips for Using Velocity
- Track consistently: Gather velocity data over at least 3-6 sprints to establish meaningful averages and identify trends. Short-term fluctuations are normal, but a longer-term view provides a more accurate picture.
- Planning, not performance: Use velocity for planning and forecasting, not for evaluating team performance or comparing teams. Velocity is relative to each team’s context and working style.
- Velocity bands: Consider using velocity bands (ranges) rather than aiming for exact numbers. This allows for natural variations in team output and reduces pressure to hit specific targets.
- Regular calibration: Regularly reassess and recalibrate your story point system. This ensures story points remain a consistent measure of effort and complexity.
Why Velocity Matters in Agile
Velocity deserves its place among essential agile team metrics because it offers valuable insights into a team’s capacity and predictability. By tracking velocity, teams can:
- Improve forecasting: Make more realistic commitments during sprint planning.
- Enhance estimation: Refine estimation accuracy over time, leading to more reliable project timelines.
- Identify bottlenecks: Spot potential roadblocks early and adjust accordingly.
- Promote data-driven decisions: Base sprint planning on data rather than guesswork.
Velocity, when used correctly, is a powerful tool for continuous improvement in agile development. While popularized by figures like Mike Cohn, Ken Schwaber, and the Scrum Alliance, its real value lies in its practical application within individual teams.
2. Burndown Charts
Burndown charts are visual representations of work remaining versus time. They depict the progress of a sprint or release, showing how much work is left to be done each day. This allows teams to monitor their pace and quickly identify any potential delays. By visualizing progress, burndown charts facilitate proactive adjustments and improve the likelihood of meeting sprint goals. They provide a clear, shared understanding of the current state of the sprint.

Examples of Burndown Charts in Action
Many organizations successfully utilize burndown charts. Atlassian’s Jira software, used by thousands of agile teams, features built-in burndown chart functionality. ING Bank combines burndown charts with daily stand-ups to enhance sprint management and address roadblocks proactively. Salesforce uses release burndown charts for higher-level planning and tracking progress on quarterly goals. These real-world examples showcase the practical application of burndown charts across diverse industries.
Practical Tips for Using Burndown Charts
- Update daily: For accurate tracking, update the burndown chart daily, reflecting the actual work completed.
- Discuss anomalies: Use daily stand-ups to discuss any deviations from the ideal burndown line and identify the underlying causes.
- Use both sprint and release versions: Leverage sprint burndown charts for short-term tracking and release burndown charts for long-term progress monitoring.
- Combine with burnup charts: Combine burndown charts with burnup charts to gain a complete picture of scope changes and their impact on the project timeline. Learn more about sprint planning and effective utilization of burndown charts in your meetings here.
Why Burndown Charts Matter in Agile
Burndown charts are a valuable agile team metric because they promote transparency and enable data-driven decision-making. By visually representing progress, they help teams:
- Track progress effectively: Monitor the rate of work completion against the planned sprint timeline.
- Identify potential delays: Detect deviations from the planned trajectory early on, allowing for timely interventions.
- Facilitate proactive adjustments: Enable teams to adjust their approach as needed to stay on track and meet sprint goals.
- Improve communication: Provide a shared understanding of sprint progress among team members and stakeholders.
Burndown charts, while popularized by organizations like Scrum.org and agile experts like Mike Cohn, gain their true value from their practical application within teams to improve project visibility and predictability.
3. Lead Time
Lead time is a crucial agile team metric that measures the total time elapsed from when a work item (like a user story or a bug fix) is requested until it’s delivered to the customer. This metric provides valuable insights into a team’s end-to-end delivery efficiency and helps identify bottlenecks in their development process. By understanding their lead time, teams can optimize their workflow and improve their ability to deliver value quickly and predictably. This focus on speed and efficiency directly contributes to customer satisfaction and a more responsive development cycle.
Examples of Lead Time in Action
Many organizations successfully utilize lead time to streamline their processes. Amazon, a leader in efficient delivery, meticulously measures lead time from customer order to package delivery, optimizing its logistics network for maximum speed. GitHub uses lead time to track the time it takes for a feature request to be implemented and deployed to production, enabling them to manage feature development effectively. Even outside of software, Toyota’s lean manufacturing principles, with their emphasis on minimizing waste and maximizing flow, have heavily influenced how software teams measure and optimize lead time.
Practical Tips for Using Lead Time
- Clearly define start and end points: Establish clear definitions for when work is considered “started” (e.g., when a task is assigned) and “finished” (e.g., when the feature is deployed to production). This ensures consistent measurement across the team.
- Track different work types separately: Different types of work items (e.g., bug fixes, features, small tasks) may have different lead times. Tracking them separately provides a more granular understanding of your process.
- Focus on trends rather than individual items: While individual lead times can be informative, focus on overall trends and averages to identify systemic issues. Learn more about optimizing lead time with tools like Jira here.
- Use percentiles: Track lead time percentiles (e.g., 50th, 85th, 95th) to gain a better understanding of the distribution of your lead times. This helps identify outliers and areas for improvement.
Why Lead Time Matters in Agile
Lead time is a valuable agile team metric because it directly reflects a team’s ability to deliver value quickly. By focusing on reducing lead time, teams can:
- Increase customer satisfaction: Faster delivery translates to happier customers.
- Improve responsiveness to change: Shorter lead times enable teams to adapt more easily to evolving requirements.
- Identify and eliminate bottlenecks: Lead time analysis can pinpoint areas where work is slowing down, allowing teams to optimize their process.
- Promote continuous improvement: Tracking lead time provides data-driven insights for iterative process improvement.
Lead time, as championed by lean software development proponents like Mary Poppendieck and David Anderson, is essential for achieving true agility. By prioritizing lead time optimization, teams can build a more efficient and responsive development process that delivers value quickly and consistently.
4. Cycle Time
Cycle time is a crucial agile team metric that measures the time it takes to complete a work item once active work begins. Unlike lead time, which tracks the entire duration from request to delivery, cycle time focuses specifically on the active development period. This allows teams to pinpoint bottlenecks and optimize their development process efficiency by isolating the time spent actively working on a task. By understanding their cycle time, teams can identify areas for improvement within their workflow. This focus contributes directly to faster delivery and increased agility.
Examples of Cycle Time in Action
Many organizations effectively utilize cycle time to improve their development processes. Spotify, for instance, measures cycle time from the moment development starts to when the feature is deployed to production. This helps them understand the efficiency of their development pipeline. Etsy tracks cycle time for different types of features separately, allowing them to identify variations in development speed and tailor their processes accordingly. Capital One leverages cycle time to optimize its Continuous Integration/Continuous Delivery (CI/CD) pipeline, streamlining the path from code commit to deployment.
Practical Tips for Using Cycle Time
- Define clear ‘active work’ boundaries: Establish precise criteria for when work is considered “active” to ensure consistent measurement. This might include the time from the first code commit to the final testing phase.
- Segment by work item types: Track cycle time separately for different types of tasks (e.g., bugs, features, stories). This helps reveal specific areas needing improvement.
- Monitor trends over individual measurements: Focus on cycle time trends across multiple sprints rather than single data points to understand overall performance and identify patterns.
- Combine with lead time for a full picture: Use cycle time alongside lead time to understand the complete workflow and identify delays outside the active development phase.
Why Cycle Time Matters in Agile
Cycle time earns its place among essential agile team metrics because it provides a targeted view of development efficiency. By tracking and analyzing cycle time, teams can:
- Identify bottlenecks: Pinpoint slowdowns within the development process.
- Optimize workflow: Streamline processes to reduce cycle time and accelerate delivery.
- Improve predictability: Gain a more accurate understanding of development timelines.
- Enhance continuous improvement: Use data to drive iterative improvements in the development lifecycle.
Cycle time, deeply rooted in Kanban methodology and Lean principles championed by figures like David Anderson, offers a practical approach to optimizing development speed. Its true power lies in enabling teams to focus on the active development phase and identify opportunities for increased efficiency and faster delivery.
5. Cumulative Flow Diagram (CFD)
A Cumulative Flow Diagram (CFD) is a powerful agile team metric visualized as a stacked area chart. It displays the quantity of work items in different workflow states over time, offering a dynamic view of your team’s progress and process health. This metric helps visualize workflow, identify bottlenecks, and understand the stability of the development process. By tracking work item movement through various stages, teams can gain valuable insights into their efficiency and identify areas for improvement.
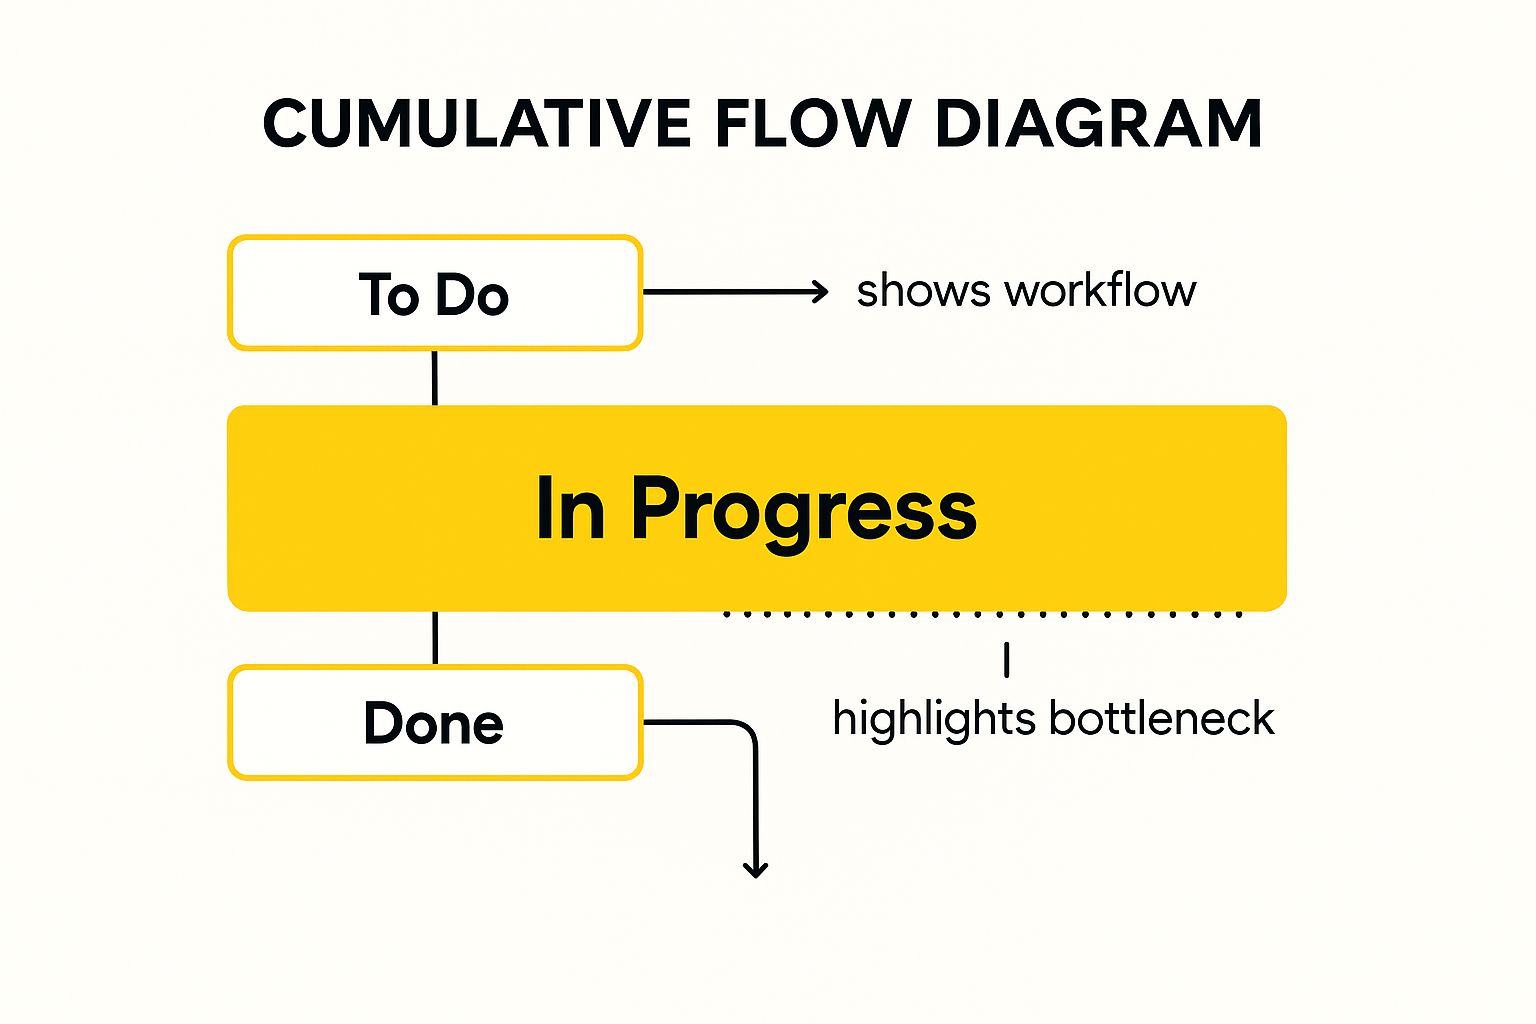
The infographic above visualizes a simplified CFD, showing the flow of work items through “To Do,” “In Progress,” and “Done” stages. The widening “In Progress” band indicates a potential bottleneck in this stage.
Examples of CFD in Action
Many organizations utilize CFDs to enhance their workflow visualization and analysis. Microsoft, for instance, uses CFDs to optimize the flow of work through their DevOps pipelines, identifying and addressing bottlenecks to improve delivery speed. Tools like Kanban Tool and LeanKit provide built-in CFD analytics, making it easy for teams to track and analyze their workflow. The principles of CFDs are even rooted in Toyota’s production line management, demonstrating the broad applicability of this visualization technique across various industries.
Practical Tips for Using CFDs
- Update regularly: Maintain data accuracy by regularly updating the CFD.
- Team training: Ensure the team understands how to interpret the CFD and identify key insights.
- Consistent states: Use consistent workflow states to maintain data integrity and allow for meaningful comparisons over time.
- Combine metrics: Combine CFDs with other flow metrics like cycle time and throughput for a comprehensive view of your process.
Why CFDs Matter in Agile
CFDs are a crucial agile team metric because they provide a visual representation of workflow dynamics. They allow teams to:
- Visualize bottlenecks: Easily identify stages where work is accumulating, indicating potential bottlenecks.
- Predict delivery: Gain insights into the likely completion time of work items based on current flow trends.
- Improve process: Use the CFD to identify areas for process improvement and optimize workflow efficiency.
- Track progress: Monitor the overall progress of work through the system and identify potential delays.
CFDs, popularized by David Anderson and integral to Kanban methodology and Lean manufacturing principles, are a valuable tool for any agile team striving for continuous improvement and efficient workflow management.
6. Escaped Defects
Escaped defects represent the number of software bugs or flaws that make their way into production, bypassing development and testing phases. This agile team metric provides a crucial measure of the effectiveness of a team’s quality assurance processes and the potential impact on the end-user experience. By tracking escaped defects, teams can identify weaknesses in their testing strategies and implement improvements to prevent future occurrences. This focus on continuous improvement is vital for delivering high-quality software and maintaining customer satisfaction.
Examples of Escaped Defects in Action
Several leading tech companies diligently monitor escaped defects as a key quality indicator. Google, for example, tracks escaped defects alongside deployment frequency to understand the relationship between speed and quality. Netflix, with its complex microservice architecture, monitors escaped defects per microservice to pinpoint specific areas for improvement. Facebook leverages escaped defect trends to refine their code review processes and enhance overall code quality.
Practical Tips for Using Escaped Defects
- Categorize by severity and impact: Not all defects are created equal. Categorizing escaped defects by their severity (critical, major, minor) and impact on users helps prioritize fixes and allocate resources effectively.
- Focus on root cause analysis: Don’t just fix the defect; understand why it happened. Root cause analysis helps identify underlying process issues and prevent similar defects from recurring.
- Track trends rather than absolute numbers: Focus on the overall trend of escaped defects over time. A decreasing trend indicates improving quality, while an increasing trend signals potential problems.
- Use for process improvement, not blame: Escaped defects should be used as a learning opportunity, not as a tool to blame individuals. Foster a culture of continuous improvement and collaborative problem-solving.
Why Escaped Defects Matter in Agile
Escaped defects are a valuable agile team metric because they directly reflect the quality of the final product delivered to the customer. By tracking and analyzing this metric, teams can:
- Improve quality assurance processes: Identify weaknesses in testing strategies and implement improvements.
- Enhance customer satisfaction: Reduce the number of bugs encountered by users, leading to a better user experience.
- Minimize rework and support costs: Fixing defects in production is significantly more expensive than catching them earlier.
- Promote a culture of quality: Emphasize the importance of quality throughout the development lifecycle.
Escaped defects, while not a glamorous metric, are essential for understanding and improving the quality of software delivered in an agile environment. Popularized by organizations like DORA and ingrained in software quality assurance best practices, this metric provides valuable insights for continuous improvement and customer-centric development.
7. Team Happiness Index
The Team Happiness Index is a subjective agile team metric used to gauge team member satisfaction, engagement, and overall well-being. It’s often collected through regular surveys, pulse checks, or retrospectives. This metric provides valuable insights into team health, identifying potential issues and highlighting areas for improvement. By understanding the factors influencing team happiness, leaders can create a more positive and productive work environment. This, in turn, can lead to improved collaboration, increased motivation, and higher quality deliverables.

Examples of the Team Happiness Index in Action
Many organizations successfully utilize the Team Happiness Index within their agile practices. Spotify, for example, incorporates happiness metrics in its Squad Health Check model, enabling teams to self-assess their well-being. Buffer, known for its transparent culture, publicly shares its team happiness scores. Atlassian employs team health monitors that include satisfaction measures, demonstrating a commitment to employee well-being. These examples showcase the value placed on team happiness in fostering high-performing agile teams.
Practical Tips for Using the Team Happiness Index
- Collect regularly and consistently: Gather happiness data at regular intervals (e.g., every sprint) to track trends and identify shifts in team morale.
- Keep responses anonymous: Ensure anonymity to encourage honest feedback and create a safe space for team members to share their perspectives.
- Act on feedback received: Don’t just collect data; take concrete actions based on the feedback received to address concerns and implement improvements.
- Use multiple measurement dimensions: Explore different aspects of team happiness, such as work satisfaction, collaboration, and psychological safety, to gain a holistic understanding of team well-being.
Why the Team Happiness Index Matters in Agile
The Team Happiness Index is a crucial agile team metric because it directly correlates with team performance and productivity. By prioritizing team happiness, organizations can:
- Boost morale and motivation: Create a positive work environment where team members feel valued and engaged.
- Improve collaboration and communication: Foster a culture of open communication and trust, leading to more effective teamwork.
- Reduce burnout and stress: Identify and address factors contributing to stress and burnout, promoting team member well-being.
- Enhance retention: Happy team members are more likely to stay with the organization, reducing turnover and maintaining team stability. Learn more about…
The Team Happiness Index, often highlighted by figures like Esther Derby and within agile retrospective practices, provides invaluable insights into the human aspect of agile teams. Its importance lies in recognizing that happy teams are more likely to be high-performing teams, contributing to overall project success.
8. Definition of Done Compliance
Definition of Done (DoD) compliance is a crucial agile team metric measuring the percentage of work items that fully satisfy the team’s pre-defined DoD criteria before completion. This metric ensures consistent quality by enforcing agreed-upon standards for finished work. It helps identify deviations from the process and highlights areas needing improvement. By tracking DoD compliance, teams can proactively address quality issues and deliver consistently valuable increments.
Examples of Definition of Done Compliance in Action
Many organizations leverage DoD compliance to enhance their agile practices. Microsoft teams, for example, track DoD compliance across their entire development lifecycle, ensuring consistent quality from design to deployment. The Scaled Agile Framework (SAFe) methodology strongly emphasizes measuring DoD compliance to ensure alignment across multiple agile teams. Furthermore, numerous financial services companies utilize DoD compliance tracking to meet stringent regulatory requirements and maintain high-quality standards.
Practical Tips for Using Definition of Done Compliance
- Keep criteria clear and measurable: The DoD should contain specific, verifiable criteria. Avoid vague language and ensure each item can be objectively assessed.
- Review and update regularly: The DoD isn’t static. Regularly review and update the criteria to reflect changing project needs and evolving best practices.
- Automate checking where possible: Automate aspects of DoD verification, such as code style checks or automated testing, to streamline the process and reduce manual effort.
- Use for improvement, not punishment: DoD compliance should be used as a learning tool, not a means of penalizing team members. Focus on identifying areas for process improvement and fostering a culture of quality.
Why Definition of Done Compliance Matters in Agile
DoD compliance is essential for several reasons. It ensures predictable quality, reduces rework by catching issues early, and fosters shared understanding within the team about what constitutes “done.” This metric allows for continuous process improvement by highlighting areas where the team can refine its working practices. Learn more about Definition of Done Compliance.
Definition of Done compliance deserves its place among key agile team metrics because it provides a concrete measure of quality adherence. By tracking and improving DoD compliance, agile teams can deliver more consistently valuable and reliable results. This focus on quality, combined with iterative development, is central to the philosophy championed by prominent agile figures and methodologies.
Agile Team Metrics Comparison Matrix
| Metric | Implementation Complexity 🔄 | Resource Requirements ⚡ | Expected Outcomes 📊 | Ideal Use Cases 💡 | Key Advantages ⭐ |
|---|---|---|---|---|---|
| Velocity | Low | Moderate | Improved sprint planning and forecasting | Agile teams needing capacity planning | Predictable planning capacity, simple to use |
| Burndown Charts | Low | Low | Real-time progress tracking | Sprint and release progress monitoring | Easy visualization, early delay warnings |
| Lead Time | Moderate | Moderate | Measure of end-to-end delivery efficiency | Understanding overall delivery speed | Customer-focused, reveals bottlenecks |
| Cycle Time | Moderate | Moderate | Optimized development process efficiency | Focus on active development optimization | Direct measure of team efficiency |
| Cumulative Flow Diagram | High | High | Workflow visibility and bottleneck ID | Teams managing complex workflows | Comprehensive view, early bottleneck detection |
| Escaped Defects | Low | Low to Moderate | Quality assurance effectiveness assessment | Measuring production defects and QA gaps | Direct customer impact measure |
| Team Happiness Index | Low | Low | Insights into team satisfaction and health | Tracking team morale and engagement | Early issue indicator, correlates with productivity |
| Definition of Done Compliance | Moderate | Moderate | Quality standards adherence | Ensuring consistent quality before completion | Reduces technical debt, improves predictability |
Final Thoughts
Effectively utilizing agile team metrics is crucial for continuous improvement and achieving project success. This deep dive into essential agile team metrics has explored key indicators like velocity, burndown charts, lead time, cycle time, cumulative flow diagrams, escaped defects, team happiness index, and definition of done compliance. Each metric offers a unique perspective on team performance, enabling data-driven decisions and fostering a culture of iterative refinement. By understanding how to collect, interpret, and act upon these metrics, teams can identify bottlenecks, optimize workflows, and deliver higher-quality products.
Key Takeaways and Next Steps
This article emphasized the importance of aligning agile team metrics with project goals and team context. Remember that no single metric provides a complete picture. Instead, a combination of metrics offers a holistic view of team health and performance. To maximize the value of these metrics, consider the following next steps:
- Experiment and Iterate: Don’t be afraid to try different metrics and combinations. What works for one team might not work for another. Find the set of agile team metrics that best aligns with your specific needs and context.
- Focus on Actionable Insights: Collecting data is only the first step. The true value lies in translating data into actionable insights that drive positive change within the team. Regularly review your metrics and identify areas for improvement.
- Foster a Culture of Transparency: Openly share metric data with the team and encourage collaborative discussion. This fosters trust and empowers team members to take ownership of their performance.
- Regularly Re-evaluate Your Approach: The agile landscape is constantly evolving. Periodically review your chosen metrics and adjust your approach as needed to ensure they remain relevant and effective.
The Power of Data-Driven Agility
Mastering the use of agile team metrics empowers teams to move beyond gut feelings and make data-driven decisions. This leads to improved predictability, reduced risk, and increased stakeholder satisfaction. By embracing a data-driven approach, teams can unlock their full potential and consistently deliver high-value products. This translates to not just project success, but also a more fulfilling and productive work environment for everyone involved.
Are you ready to elevate your agile practices and harness the power of data-driven insights? Resolution Reichert Network Solutions GmbH can help you implement and optimize your agile team metrics strategy. Visit resolution Reichert Network Solutions GmbH to learn how their expertise in network solutions can support your agile transformation.
