
Monitoring your service level agreements isn’t just some technical box-ticking exercise. Think of it as the strategic glue connecting your IT performance directly to your business’s health and, most importantly, your customer’s trust. When you get monitoring right, you turn contractual promises into real, measurable actions that protect both your reputation and your bottom line.
Why SLA Monitoring Is Your Business Lifeline
Let’s ditch the textbook definitions for a minute. In the real world, solid SLA monitoring isn’t just about watching server CPU load. It’s about shifting focus to what actually matters: user experience and contractual promises. It’s the difference between knowing a server is busy and knowing your customers are staring at a 3-second login delay that just breached their contract.
This kind of targeted approach helps you cut through the “alert noise” that drives so many technical teams crazy. Instead of jumping on every minor server hiccup, your teams can zero in on issues that genuinely degrade service quality, responding faster and with way more context.
From Technical Metrics to Business Outcomes
Modern monitoring has finally bridged the gap between IT observability and business goals. The best systems can translate those abstract promises in your contracts into concrete, measurable targets. With automated tracking, you get a real-time view of service adherence, with actionable alerts firing only when a user-facing threshold is about to be crossed. This method drastically cuts down on alert fatigue by filtering out all the low-impact noise and gives your team the context they need to resolve incidents faster. You can learn more about how this shift strengthens technical resilience and team communication.
The financial upside is pretty clear, too:
- Slash Downtime Costs: Proactive monitoring means you can resolve minor issues long before they snowball into major, contract-breaching outages.
- Build Unbreakable Customer Trust: Consistently hitting or even beating your promised service levels is one of the quickest ways to earn rock-solid customer loyalty.
- Smarter Resource Planning: The data you get from SLA monitoring shows you trends in service reliability, helping you put your people and money where they’ll make the biggest impact.
Building a Strong Foundation
Of course, your monitoring setup is only as good as the agreement it’s based on. Before you even think about building dashboards and setting up alerts, you absolutely need a well-defined contract in place. To make sure your agreements are crystal clear and cover all the bases, starting with some proven Service Level Agreement (SLA) templates can be a huge help.
The real goal of SLA monitoring is to create a common language between your tech teams and the business side. When everyone is looking at the same data-backed metrics, conversations about performance, investment, and priorities suddenly become a whole lot more productive and aligned.
Defining Meaningful Metrics That Reflect Reality
To make your SLA monitoring truly effective, you need to start with metrics that actually mean something to your users. It’s easy to fall into the trap of using generic goals, but that’s a fast track to wasting time and resources. The real magic happens when you translate your business promises into concrete technical targets that mirror the real-world customer experience.
This isn’t about vague promises like “good uptime.” It’s about getting specific. Instead, you’d set a hard target like 99.95% availability for your critical login API. This kind of precision makes your monitoring focused and directly ties it to something that matters—a customer being able to access their account.
Connecting Metrics to User Journeys
The most powerful metrics are the ones you can trace directly back to important user workflows. Think about an e-commerce platform. Sure, you can monitor general server response time, and that’s a decent start. But it doesn’t really tell you the whole story.
A much smarter approach is to zero in on the key steps of the actual customer journey.
- Checkout Flow Performance: A great goal here would be making sure the “Add to Cart” API call completes in under 300ms for 99% of all requests.
- Product Search Latency: You could aim for search results to load in under 500ms, even during your busiest sales periods.
- Payment Processing: A critical one. You could target a transaction success rate where system errors cause less than a 0.1% failure rate.
When you map your metrics to specific actions like these, you force your monitoring efforts to concentrate on what directly impacts customer happiness and, let’s be honest, your revenue. It also makes prioritizing alerts and incidents a whole lot simpler. If you’re looking for more ideas on this, our guide on structuring different types of SLAs has some excellent examples.
A good way to structure this is to think about what a user expects from different services. Certain metrics are just more important depending on the context.
Here’s a quick breakdown of how you might think about this for different service types:
Key SLA Metrics by Service Type
| Service Type | Primary Metric | Example Target | Business Impact |
|---|---|---|---|
| E-commerce Platform | Transaction Success Rate | > 99.9% success | Directly impacts revenue and customer trust. |
| SaaS Application | API Response Time | < 200ms (95th percentile) | Affects user experience and application usability. |
| Internal Help Desk | First Response Time | < 15 minutes | Determines employee satisfaction and productivity. |
| Data Warehouse | Data Freshness | Data updated within 1 hour | Critical for timely business intelligence and reporting. |
As you can see, the “right” metric is completely dependent on the service’s purpose. Tying your targets to the business impact is what makes them meaningful.
Beyond Availability and Performance
While uptime and speed get most of the attention, they aren’t the only things that matter. I’ve seen teams get burned by overlooking data integrity until something goes horribly wrong. For instance, if you have a SaaS app with a data import feature, a powerful metric would be ensuring a data corruption rate of less than 0.05% on every single file that gets uploaded.
This kind of metric is part of a growing focus on overall data quality. More and more, enterprises are realizing that Data SLAs are vital for success. These agreements specify standards for data accuracy and completeness, with monitoring in place to verify compliance and flag breaches. You can discover more about how data SLAs improve operational efficiency and build trust if you want to dig deeper into this.
The objective is to create a monitoring framework that sees your service through your customer’s eyes. When they can’t log in, complete a purchase, or trust their data, it doesn’t matter if your CPU load is low. Your metrics must reflect their reality.
Ultimately, defining the right metrics comes down to a shift in perspective. You have to stop just monitoring infrastructure and start monitoring the actual user experience. This approach doesn’t just help you avoid SLA breaches—it gives you a much clearer, more honest picture of your service’s health, guiding your team to make smarter, truly customer-centric decisions.
Choosing and Configuring Your Monitoring Tools
Picking the right tool for SLA monitoring is one of those choices that can make or break your success. It’s not about grabbing what’s popular; it’s about finding a tool that actually fits your team’s workflow, your specific tech stack, and the metrics you just spent all that time defining. The last thing you want is a tool that can’t grow with you or, worse, buries critical alerts in a clunky, confusing interface.
This decision is getting more important by the day. The global market for these tools is already valued at roughly $5 billion and is expected to grow at a compound rate of about 15% through 2033. That explosive growth tells you one thing: businesses everywhere are realizing they need rock-solid guarantees for uptime and performance to keep their promises. You can dig into more details about this expanding market and its drivers.
Key Features to Demand in a Monitoring Tool
When you’re looking at different options, you have to see past the marketing fluff. What really matters are the core features that turn monitoring into action.
Don’t settle for anything less than a tool that offers:
- Real-time Alerting: You need to know when a metric is trending toward a breach, not just after the damage is done. Instant notifications are non-negotiable.
- Customizable Dashboards: One size does not fit all. You need to spin up different views—a high-level summary for executives, and a granular, deep-dive dashboard for your engineers.
- Seamless Integrations: Your monitoring tool can’t live on an island. It must plug directly into your incident response platforms (like PagerDuty), team chat (like Slack or Microsoft Teams), and of course, your help desk software. Planning these connections is crucial, and our guide on key help desk metrics can give you some great ideas on what to sync.
Ultimately, you need to balance scalability, ease of use, and total cost. A cheap tool that takes your best engineer two weeks to set up is no bargain.
Setting Up Your Monitoring Rules and Alerts
Okay, you’ve picked your tool. Now for the real work: configuration. This is where you bring your SLA metrics to life by turning them into automated checks and alerts. The goal is to build a system that’s smart enough to catch real problems without drowning your team in false alarms.
For each key metric, you’ll want to create a specific monitoring rule. If you’re tracking API response time, for example, that means setting a hard threshold—let’s say an alert triggers anytime response time is >300ms.
Your configuration should be tiered. A ‘Warning’ can ping an on-call engineer about a potential problem, while a ‘Critical’ alert should kick off a full-blown incident response. This approach is the key to preventing alert fatigue and helping your team focus on what truly matters.
Finally, think carefully about your notification channels. A minor database latency issue might just need a message in a specific team’s chat. But a critical, system-wide outage? That should automatically page the primary on-call engineer and escalate up the chain if it isn’t acknowledged quickly. As you build this out, it helps to keep general network monitoring best practices in mind to ensure your whole infrastructure is covered.
Get this part right, and you’ll have a system that puts the right alert in front of the right person, at the right time, every single time.
Visualizing Performance with Actionable Dashboards
Let’s be honest: raw data from your monitoring tools is mostly noise until you give it some context. The real magic in service level agreement monitoring happens when you translate those endless streams of metrics into a clear, visual story. That’s where actionable dashboards come in—they turn abstract numbers into something your team can actually use.
The guiding principle for any good dashboard is clarity over complexity. It should tell you the health of your service in a single glance, without making you squint at complex charts or hunt for what a number actually means. This is how you go from just showing data to truly visualizing performance.
Tailoring Dashboards for Different Audiences
One of the most common mistakes I see teams make is trying to build one master dashboard to rule them all. It never works. What an executive needs to see is worlds away from the nitty-gritty details an engineer on call needs at 3 AM. You absolutely have to tailor the views to make the data relevant for each person.
-
For Executives: Think high-level summary. They care about business outcomes. Focus on metrics like overall service availability (e.g., 99.95% uptime), customer satisfaction scores, and the status of any major incidents. Keep it clean, visual, and tied to the bottom line.
-
For Engineers: This is where you get into the weeds. Give them the deep, technical view with things like API response time histograms, database query performance, and resource saturation levels. This dashboard’s job is to help them find the root cause of a problem, fast.
By creating these role-specific views, you ensure everyone gets the right information in the right format. If you need some inspiration, checking out different performance dashboard examples can give you some great ideas for your own designs.
A dashboard’s true value isn’t measured by how much data it shows. It’s measured by how quickly and clearly it answers one simple question: “Are we keeping our promises to our customers right now?”
Essential Widgets for SLA Monitoring
When you start building your dashboards, a few types of visualizations are especially powerful for tracking SLA compliance. These widgets are what transform your carefully defined metrics into intuitive signals that scream health, risk, or failure.
Consider adding these chart types to your toolkit:
-
Uptime Gauges: It doesn’t get much clearer than this. A simple gauge showing your current uptime against your target (like 99.9%) is instantly understood by anyone. If you color-code it—green for good, yellow for warning, red for breached—it becomes even more effective.
-
Response Time Heatmaps: These are fantastic for spotting patterns. A heatmap can instantly show you if latency is spiking at specific times of day, helping you diagnose performance slowdowns before they become critical problems.
-
Error Budget Burndown Charts: For any team practicing Site Reliability Engineering (SRE), this is a non-negotiable chart. It shows exactly how much of your “allowable downtime” you’ve burned through during your SLA period. A steeply dropping line is an immediate signal to the team to pump the brakes on new features and focus on stability.
Your end goal is a dashboard that gives your team an instant gut check on service health. It should empower them to see trouble coming and make proactive moves long before an SLA breach is even a remote possibility.
Integrating Monitoring into Your Team’s Workflow
Having a slick SLA monitoring setup is one thing, but it’s only as good as its integration into your team’s actual, day-to-day work. Real operational integration isn’t just about firing off an alert. It’s about weaving that monitoring data into the very fabric of how your team responds to incidents, communicates, and plans for the future.
This is where most strategies fall flat—the human side of the process. You need to establish crystal-clear protocols for how your team acts on the information your tools provide. Without that, even the most accurate alert is just noise. The aim is to build a predictable, efficient system where every alert gets the right action from the right person, every single time.
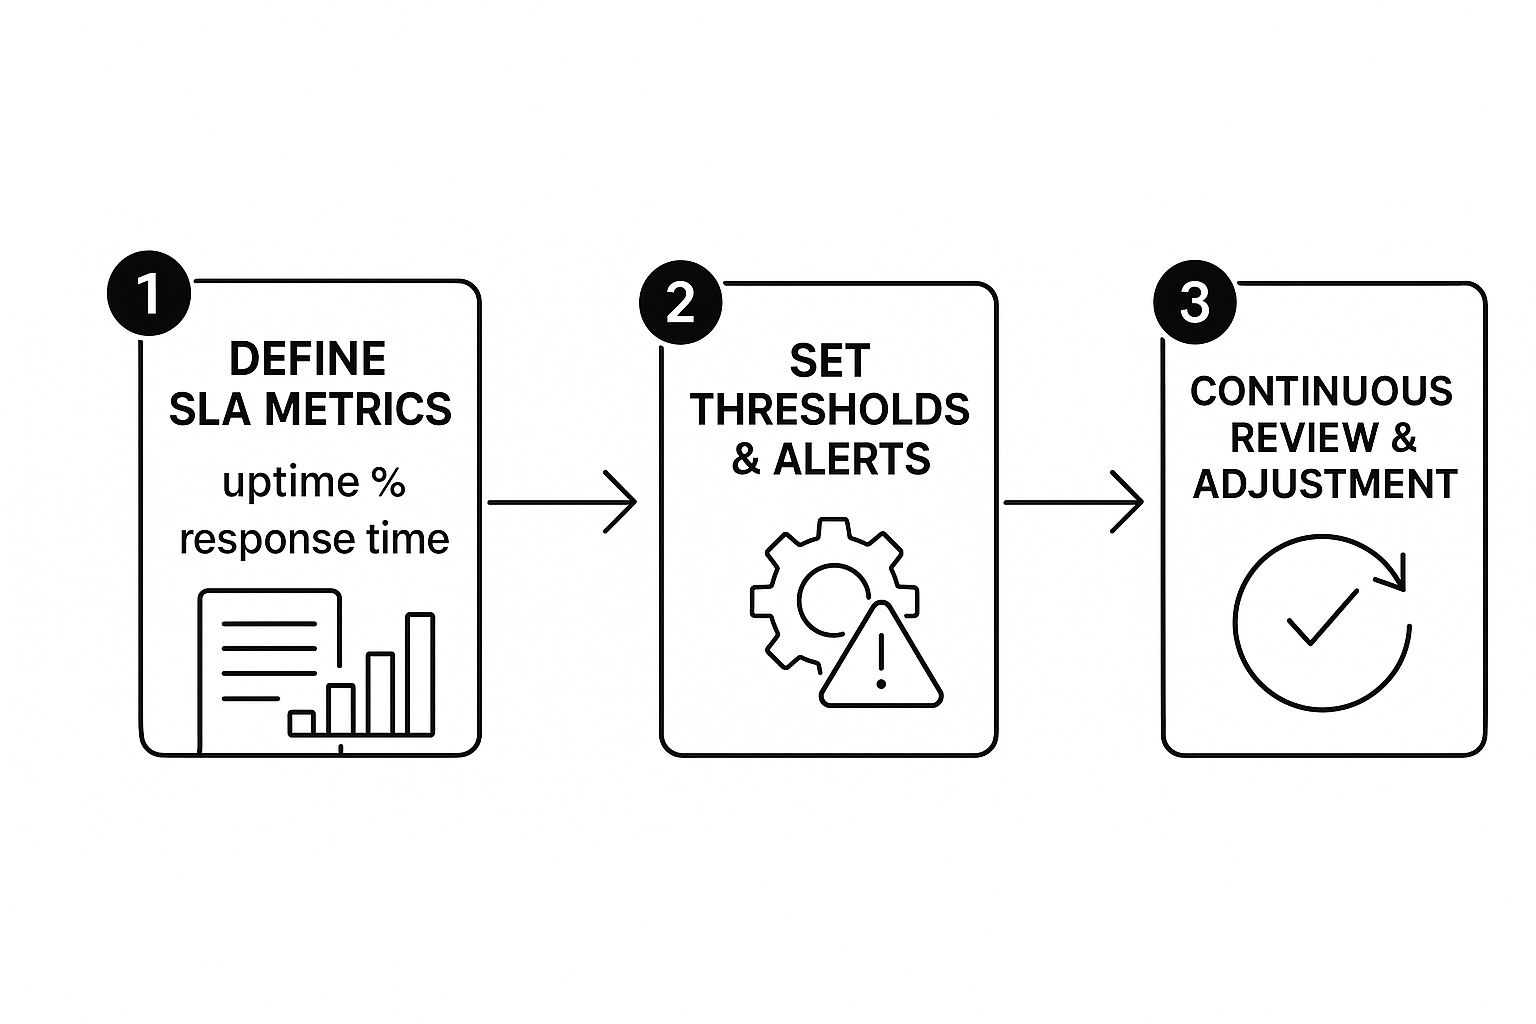
This infographic breaks down the essential feedback loop for a healthy monitoring process.
As the visual shows, monitoring isn’t a “set it and forget it” task. It’s a continuous cycle of defining what matters, measuring it, and then making smart adjustments.
Connecting Alerts to On-Call and OOO Schedules
Here’s a critical piece of the puzzle that teams often miss: tying your alert system directly to your team’s real-world availability. Picture this: your lead engineer is on a much-needed vacation, and a critical P1 alert lands in their inbox. It just sits there, unread. That’s a textbook recipe for a disastrous SLA breach.
To sidestep this nightmare scenario, you absolutely must integrate your monitoring tools with your on-call schedules and—this is key—your team’s out-of-office rules. This is the only way to ensure alerts are intelligently routed to the person who is actually on deck and responsible at that moment.
When someone sets up their out-of-office message, it can be the trigger that automatically reroutes critical alerts.
By hooking these calendar events into your workflow, you can automate the delegation of incoming tasks and alerts.
Modern productivity suites allow you to set up absence rules that automatically reassign tickets and approvals to a designated backup. When you connect this to your monitoring system, you guarantee that no critical alert ever gets lost in a vacation auto-responder. It’s a simple change, but one that can dramatically cut down your incident response times.
Fostering a Culture of Continuous Improvement
Once an incident is resolved, the job’s not done. Far from it. Your monitoring data is a goldmine of insights for getting better.
- Run blameless post-mortems. After any SLA breach, get the team together for a blameless post-mortem. The focus should never be on “who messed up?” but rather “what part of the system failed us?” Use your monitoring data to piece together the timeline and pinpoint the true root cause.
- Refine your alerts. Was an alert too sensitive, leading to alert fatigue? Or did it fire too late to prevent a real problem? Use the data from recent incidents to fine-tune your thresholds and make your alerts more meaningful.
- Drive proactive fixes. Start looking for trends in your monitoring dashboards. Are you seeing the same type of issue pop up again and again? This data is the hard evidence you need to justify prioritizing fixes for technical debt over shipping the next new feature.
Integrating your monitoring data into a clear protocol is the backbone of mature operations. It forms a key part of your overall incident response strategy, ensuring you can meet recovery objectives and maintain service quality.
Creating this feedback loop is how your team moves from a reactive, firefighting mode to a proactive state of continuous improvement. If you’re looking to put a more formal structure around this, digging into established incident management best practices can give you a solid framework to build on. This kind of structured approach turns every incident into a valuable lesson learned.
Frequently Asked Questions About SLA Monitoring
Even with the best plan in the world, a few questions always pop up when you start getting serious about service level agreement monitoring. Let’s tackle some of the most common ones I hear from teams just like yours.
What Is the Difference Between an SLA, SLO, and SLI?
This one trips people up all the time, but it’s actually pretty simple when you think of it as a hierarchy. Each term builds on the last to create a clear picture of service quality, from raw data to a customer-facing promise.
-
Service Level Indicator (SLI): This is the raw, unvarnished measurement. It’s the “what” you’re tracking. Think API response time in milliseconds or the exact percentage of successful web requests. It’s just the data.
-
Service Level Objective (SLO): This is your internal goal based on that SLI. It’s where you draw a line in the sand for your team. An SLO might be, “API response time will be under 300ms for 99% of requests.” It’s the target you’re aiming for internally.
-
Service Level Agreement (SLA): Now we get to the formal part. An SLA is the contract you sign with your customer. It bundles one or more of your SLOs and clearly defines the consequences—like service credits or other penalties—if you fail to meet those objectives.
So, to put it simply: SLIs measure the facts, SLOs set the internal goal, and SLAs turn that goal into a binding promise with your customers.
How Do You Start SLA Monitoring with a Small Team?
When you’re a small team, the biggest mistake is trying to boil the ocean. The secret is to start small, prove the value, and then build from there.
My advice? Pinpoint the single most critical journey for your users. Maybe it’s the customer login process or the main checkout flow on your e-commerce site. Pick one, and only one, to start. Then, define just one or two simple SLOs for that specific journey. Uptime or availability is almost always a fantastic starting point.
You don’t need a massive budget. Use free-tier or open-source monitoring tools to track these initial metrics. This approach gives you a quick, focused win that highlights the importance of your most crucial workflow. Once you have that data, it’s much easier to justify dedicating more resources to expand your monitoring.
An SLO doesn’t have to be perfect on day one. It’s far better to have a reasonable, “good enough” objective that you can actually track than to have no objective at all while you’re stuck debating perfection.
How Often Should We Review Our SLAs?
Think of your SLAs as living documents, not stone tablets. They should never be a “set it and forget it” activity. Your business changes, your tech stack evolves, and what customers expect today will be different next year. Your SLAs absolutely have to keep pace.
I recommend a formal review of your SLAs and their underlying SLOs at least quarterly. On top of that, you should trigger an immediate review anytime there’s a major change to your service, like launching a significant new feature or migrating to a different cloud provider.
Use these reviews to really dig into your monitoring data. Are your targets still relevant? Are they challenging enough? Is your alerting system just creating noise? This regular check-in is what separates a world-class monitoring program from one that just goes through the motions. It ensures your strategy provides real value and accurately reflects what it means to succeed. You can even explore different ways of how to measure project success to get new ideas for these reviews.
Ready to prevent SLA breaches caused by team absences? With resolution’s Out of Office Assistant for Jira, you can automate handovers and ensure critical alerts and tasks are always routed to an available team member. Take the guesswork out of vacation coverage and start your free trial.
