

Understanding Sprint Velocity Formula Fundamentals
Understanding sprint velocity is essential for effective Agile project management. This metric helps teams transition from guesswork to data-driven decisions, providing a solid base for sprint planning and predictable delivery. It offers valuable insights into a team’s capacity, helping build trust with stakeholders and maintain realistic project timelines.
What Is Sprint Velocity?
Sprint velocity represents the amount of work a team can realistically complete during a sprint. It’s typically measured in story points, units assigned to user stories that reflect their complexity and effort. Consider it the team’s average “speed” for completing work. This helps estimate how much can be achieved within a given timeframe, creating accurate project roadmaps and attainable sprint goals.
The Core Formula
Calculating sprint velocity is simple. It’s the average number of story points a team completes over several sprints. This historical data creates a crucial baseline for future planning. Sprint velocity is calculated by dividing the total number of story points completed by the number of sprints.
For example, if a team completed 20 story points in Sprint 1, 21 story points in Sprint 2, and 40 story points in Sprint 3, their total story points would be 81. Dividing this by the number of sprints (3) gives an average sprint velocity of 27 story points per sprint. Find more detailed information here: Understanding Sprint Velocity
Why Focus on the Fundamentals?
Understanding these fundamentals is critical. A correct understanding of sprint velocity fosters better communication and more accurate predictions. It allows teams to:
-
Plan realistically: Understanding their average velocity helps teams commit to a manageable workload each sprint. This minimizes the risk of overcommitment and maximizes the chances of success.
-
Track progress effectively: Velocity offers a clear metric to monitor progress sprint over sprint, identifying potential bottlenecks or process improvements.
-
Manage stakeholder expectations: A stable velocity helps build confidence with stakeholders. It provides a data-driven basis for project timeline estimations and release forecasts.
This foundational understanding is essential before exploring more advanced velocity analysis and application. It sets the stage for effectively leveraging velocity for team excellence. In the following sections, we will explore how to apply these fundamentals to real-world sprint planning scenarios.
Mastering Step-By-Step Velocity Calculations
Calculating sprint velocity is essential for effective sprint planning. This section provides a practical, step-by-step guide to mastering these calculations, addressing common hurdles and ensuring data accuracy.
Handling Partial Sprints and Carryovers
Many teams encounter partial sprints due to holidays or unforeseen absences. How should you handle these disruptions? Instead of discarding the data, adjust the sprint velocity calculation to reflect the actual working days. For example, if a two-week sprint is shortened to one week due to holidays, base the velocity on that one week’s output. This provides a more realistic view of the team’s true capacity.
Similarly, story point carryovers from unfinished tasks should be included in the next sprint’s total. This ensures a consistent and accurate measure of completed work.
Maintaining Consistency Amidst Change
Changes in team composition or sprint lengths can complicate velocity calculations. Focusing on story points per day, rather than per sprint, can offer greater consistency. By calculating the average daily story point completion, you can effectively adapt to varying sprint lengths and team sizes.
This daily approach also allows for more accurate project timeline predictions, even with unexpected changes.
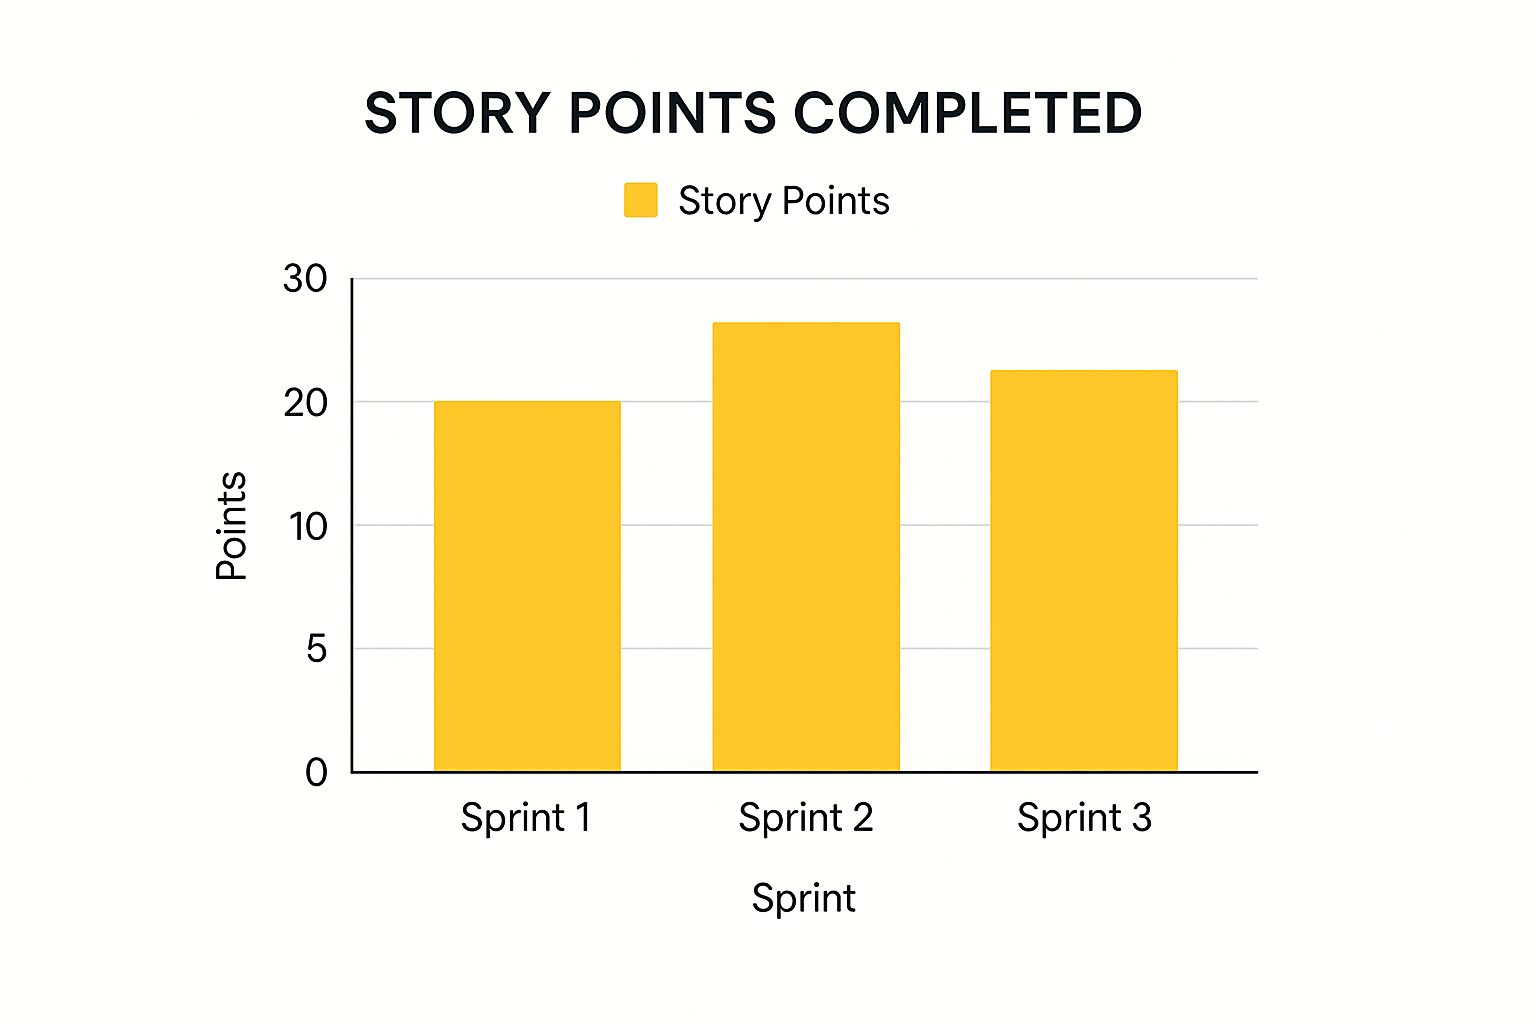
The infographic above visually represents story points completed across three sprints. Sprint 2 shows the highest output, while Sprint 3 shows a slight dip. Tracking these fluctuations helps teams identify potential bottlenecks and improve future performance. For further insights into sprint planning tools, check out this resource: Top Sprint Planning Tools for 2025 – Boost Team Productivity.
Gathering Accurate Data and Tracking Progress
Accurate velocity calculations rely on reliable data. Consistent story point estimation practices are crucial. This includes regular refinement sessions and clear definitions of “done” for each task.
Using dedicated tools like Jira for tracking story points and sprint progress can streamline the calculation process and minimize manual errors. These tools also facilitate the documentation of velocity trends, providing valuable insights for retrospective analysis and future planning.
Using Historical Velocity for Predictions
Historical sprint velocity is a valuable metric in Agile, helping teams predict future performance and plan effectively. The following table provides examples of velocity calculations:
Let’s look at how to calculate historical velocity. To illustrate, imagine a team completed 28 story points in Sprint 1, 30 story points in Sprint 2, and 32 story points in Sprint 3. Their historical velocity would be calculated as (28 + 30 + 32) / 3 = 30 story points per sprint.
The table below illustrates different sprint velocity scenarios:
| Sprint Number | Story Points Completed | Calculation Method | Average Velocity |
|---|---|---|---|
| 1 | 28 | – | – |
| 2 | 30 | – | – |
| 3 | 32 | (28 + 30 + 32) / 3 | 30 |
This table breaks down the calculation, demonstrating how average velocity is determined over multiple sprints. This historical data provides a baseline for future sprint planning. You can find additional information on historical velocity and capacity planning here. By mastering these fundamental steps and incorporating best practices, your sprint velocity calculations will provide valuable data for effective project management.
Turning Historical Data Into Accurate Predictions
Turning historical sprint velocity data into accurate predictions is more involved than simply averaging past sprints. It requires a deep understanding of the factors that influence your team’s capacity. This involves analyzing velocity trends over several sprints to pinpoint the key signals for future planning. For example, consistent upward or downward trends could indicate improving team performance or emerging bottlenecks, respectively.
Handling Fluctuations and External Factors
High-performing Agile teams go beyond simply calculating sprint velocity; they analyze it. They understand that external dependencies, seasonal capacity changes, and unexpected scope creep can significantly affect their sprint velocity formula results. Learn more in our article about your ultimate guide to sprint planning. A team’s velocity, for instance, might naturally dip during holidays or when onboarding new members.
Sophisticated prediction approaches account for these variations. They might involve adjusting historical data to compensate for known disruptions. Another strategy is using weighted averages that prioritize recent sprints. This keeps predictions realistic, even when circumstances shift.
Building Realistic Baselines
Successfully using the sprint velocity formula depends on establishing a realistic baseline. This means factoring in elements often overlooked in traditional velocity calculations. Agile coaches guide teams in building these baselines by considering factors like learning curves on new projects, the impact of technical debt, and the changing complexity of the product.
This approach provides a more accurate starting point for future predictions, leading to more achievable sprint goals and improved communication with stakeholders. Moreover, understanding the impact of these factors allows teams to proactively address them, promoting more sustainable velocity over time.

Velocity as a Planning Tool, Not a Performance Metric
A crucial aspect of using sprint velocity effectively lies in understanding its true purpose. Velocity is a planning tool, not a performance metric. It’s designed to guide sprint planning and forecasting, not to measure individual or team productivity. Using velocity as a performance indicator can create unhealthy pressure, ultimately harming team morale and product quality.
Instead, successful Agile teams use velocity insights to set achievable goals, facilitate open communication about capacity, and foster continuous improvement. This approach ensures that velocity remains a valuable asset for driving team excellence, not a source of stress or misaligned expectations.
Applying Velocity Formula In Real Sprint Planning
Let’s dive into how seasoned teams use the sprint velocity formula to boost their planning. This goes beyond simple math—it’s about turning velocity data into solid sprint commitments, realistic release timelines, and stakeholder communication that builds trust.
Capacity Planning and Workload Distribution
Effective Scrum teams use velocity as their guide for capacity planning. Knowing their average velocity helps them distribute work and negotiate scope effectively.
For instance, if a team’s velocity is 25 story points per sprint and a new feature is estimated at 30 story points, the team can confidently discuss reducing the feature’s scope or splitting it across multiple sprints. This proactive approach helps avoid overcommitting and encourages realistic planning.
Adapting to Change
Sprint lengths, team changes, and unexpected events can all impact a team’s delivery capacity. Adaptable teams adjust their sprint velocity calculations to reflect these changes.
This might involve calculating velocity daily instead of per sprint to better handle varying sprint lengths and team sizes. They also understand that external dependencies can significantly affect velocity and include this in their plans.
From Velocity Data to Actionable Insights
Experienced Agile practitioners know the sprint velocity formula isn’t just about the numbers. It’s about sparking important conversations within the team about scope, bandwidth, and project details.
Many successful engineering teams actually prioritize the discussions that velocity tracking promotes rather than rigidly following the metric itself. Explore this topic further. These conversations often center on potential roadblocks, dependencies between tasks, and refining estimations. You might find this helpful: How to master sprint planning with an agenda template.
Balancing Velocity with Other Factors
While the sprint velocity formula is a useful guide, it’s important to acknowledge its limitations. Factors like team morale, individual skill sets, and unexpected technical hurdles can all influence a sprint’s outcome.
Understanding this helps teams balance velocity-based predictions with a realistic assessment of the project’s overall context. For example, a sudden influx of complex bugs might require adjusting sprint goals, even if the team’s velocity suggests otherwise.
Communicating with Stakeholders
Communicating effectively about velocity is crucial for building stakeholder trust. Instead of presenting velocity as a fixed promise, high-performing teams frame it as a planning tool that helps create realistic timelines.
This transparency encourages collaboration and ensures stakeholders grasp the dynamic nature of Agile development. It also allows for open discussions about scope adjustments and potential trade-offs, fostering a shared understanding of the project’s progress. By combining velocity data with qualitative insights, teams can provide a well-rounded view of their work, building confidence and alignment with stakeholders.
Avoiding Velocity Calculation Pitfalls That Kill Planning

Accurately applying the sprint velocity formula is essential for successful sprint planning. However, even seasoned Agile teams can stumble into common traps that make their velocity data unreliable. This section explores these pitfalls and provides practical solutions to keep your velocity calculations accurate.
The Danger of Velocity as a Performance Metric
One of the biggest mistakes is using velocity as a performance metric. This creates unhealthy pressure, encouraging teams to inflate story point estimations and compromise quality.
For example, a team pushing for a higher velocity might rush through tasks. This can lead to a build-up of technical debt, ultimately slowing down future sprints. Velocity should be a planning tool for forecasting and capacity planning, not a performance benchmark.
The Human Factor
Another common mistake is overlooking the human element. Factors like team morale, individual skill sets, and unforeseen absences can significantly impact sprint outcomes.
Relying solely on the sprint velocity formula without considering these human factors leads to unrealistic expectations and missed deadlines. Teams need to acknowledge and account for these variables.
Handling Velocity Fluctuations
Velocity naturally fluctuates. Team changes, shifts in project complexity, and external dependencies can all contribute to variations. Instead of panicking over these fluctuations, teams should investigate the underlying causes.
A drop in velocity after onboarding new team members, for instance, might indicate a need for more training or mentoring. Addressing these issues proactively is far more effective than simply pushing for a return to previous velocity levels. Learn more in our article about How to master sprint planning best-practices.
Maintaining Accuracy Despite Change
Maintaining accurate velocity calculations requires ongoing attention, especially as teams and projects change. Changes in team composition necessitate adjustments to the baseline velocity. Shifts in project scope can also impact story point estimations, requiring recalibration of the sprint velocity formula.
Recognizing Misleading Data
Sometimes, velocity data can actively mislead planning decisions. This often happens when underlying issues, like inconsistent story point estimations or undocumented dependencies, skew the data.
The following table, “Velocity Calculation Troubleshooting Guide”, outlines common problems and their solutions:
To help teams navigate these challenges, we’ve compiled a troubleshooting guide for common velocity calculation problems. This guide helps identify the impacts of these mistakes and provides practical solutions and prevention strategies.
| Common Mistake | Impact on Planning | Solution | Prevention Strategy |
|---|---|---|---|
| Inconsistent Story Pointing | Unreliable Velocity | Recalibrate Estimations | Regular Refinement Sessions |
| Ignoring External Dependencies | Overcommitment | Account for Dependencies | Dependency Mapping |
| Treating Velocity as a Performance Metric | Inflated Estimations | Focus on Planning | Emphasize Value Delivery |
This table highlights common issues that can lead to inaccurate velocity calculations. By understanding these issues and implementing the suggested strategies, teams can maintain reliable velocity data.
By understanding these pitfalls and using the provided solutions, teams can ensure their sprint velocity formula remains a valuable tool for planning and continuous improvement. This results in more accurate predictions, realistic sprint commitments, and ultimately, more successful projects.
Using Velocity Analysis To Drive Team Excellence
Turning velocity data into actionable insights is the key to continuous improvement for any Agile team. This means looking beyond the raw numbers and understanding the story they tell. By doing so, you can pinpoint bottlenecks in your workflow, identify opportunities for skill development, and ultimately, boost your long-term velocity.
Velocity Trends as Diagnostic Tools
Experienced Agile coaches use velocity trends as powerful diagnostic tools. They examine these trends not simply to track speed, but also to assess team health, process effectiveness, and quality maintenance. For example, a consistent downward trend in sprint velocity could indicate growing technical debt or emerging communication issues within the team. On the other hand, a steady upward trend, assuming story point estimations remain consistent, often suggests improved processes and increasing team proficiency. Read also: How to improve your daily scrum.
Coaching Teams Toward Consistent Velocity
Maintaining a consistent velocity is essential for predictable delivery. However, this shouldn’t come at the expense of work-life balance or the quality of the code being produced. Effective coaching strategies emphasize sustainable practices. This includes setting realistic sprint goals, encouraging healthy work habits, and fostering a culture of continuous learning and improvement. Instead of pushing for higher velocity at all costs, teams should prioritize optimizing their workflow and refining their estimation techniques.
Setting Meaningful Velocity Improvement Goals
Improvement goals should be meaningful and actionable, with a focus on process enhancements rather than simply increasing output. For example, a team might aim to reduce the number of bugs found in each sprint. This directly improves code quality and indirectly contributes to a more stable velocity. Another valuable goal might be streamlining testing procedures, which would free up time for the team to complete more tasks within a given timeframe. These types of goals lead to sustainable improvements, benefiting both the team and the overall product development process.
Measuring Progress Beyond Just Numbers
While the sprint velocity formula provides valuable quantitative data, measuring progress involves more than just crunching numbers. Qualitative factors, such as team morale and the effectiveness of communication, play a significant role in long-term success. Experienced Agile coaches recognize this and incorporate qualitative assessments into their analysis. This might involve gathering feedback through team retrospectives or conducting regular one-on-one check-ins with team members. This more holistic approach provides a richer understanding of the team’s performance and identifies areas for improvement beyond just the numbers.
Celebrating Achievements and Building Confidence
Recognizing and celebrating team achievements cultivates a positive and productive work environment. This doesn’t necessarily mean rewarding high velocity. Instead, it involves acknowledging improvements in processes, successful problem-solving, and the completion of particularly challenging goals. This positive reinforcement builds team confidence and motivates continued improvement, ultimately contributing to sustained success and greater stakeholder confidence. By shifting the focus from purely numerical targets to the underlying factors that drive success, teams can achieve genuine, lasting performance gains.
Key Takeaways For Sprint Velocity Success
Mastering the sprint velocity formula helps Agile teams make informed decisions, leading to better planning and more predictable project delivery. This section offers practical guidance on implementing effective velocity tracking, highlighting key takeaways and actionable strategies.
Building a Foundation for Success
Understanding what sprint velocity represents is crucial. It’s the average amount of work a team completes during a sprint, typically measured in story points or issue count. This understanding forms the basis for accurate planning and setting realistic goals. For example, a team consistently delivering 20 story points per sprint can confidently plan for a similar workload in the future.
It’s important to remember that sprint velocity is a planning tool, not a performance metric. Using it to evaluate team or individual performance can create unnecessary pressure and lead to inaccurate estimations. Focus instead on using velocity to improve communication, manage stakeholder expectations, and drive continuous improvement.
Implementing Effective Velocity Tracking
Effective velocity tracking starts with consistent story point estimation or issue counting. Regular refinement sessions and a well-defined definition of “done” are essential. This consistency ensures your velocity data accurately reflects the team’s actual capacity. Dedicated tracking tools like Jira can streamline the process, minimize errors, and visualize trends.
External factors can also influence velocity. Things like team changes, holidays, and unforeseen dependencies can all affect a team’s capacity. Adjusting calculations to account for these factors provides a more realistic view of your true velocity.
Troubleshooting and Continuous Improvement
Velocity fluctuations are perfectly normal. Don’t panic; investigate the underlying causes. A sudden drop might signal a need for more training, better communication, or process adjustments. Use these insights to refine your sprint planning and address any bottlenecks.
Continuous improvement is key to successful velocity tracking. Regularly analyze velocity trends along with other metrics, such as flow efficiency and cycle time. This broader perspective provides a richer understanding of team performance and helps identify growth opportunities. Regularly review and adapt your approach to velocity tracking to maximize its value as a planning and improvement tool.
Boost your team’s agile meeting efficiency with Resolution’s NASA – Not Another Standup App. Learn more and streamline your sprint planning with NASA
