
Unlocking Efficiency: Streamlining Reporting in 2025
Tired of manual reporting and data discrepancies? This listicle reveals top reporting automation tools to reclaim your time and boost productivity. Discover how these tools integrate with platforms like Jira and HubSpot, solving common data syncing and reporting challenges faced by various teams, from DevOps and sales to customer support and data analysis. We’ll explore solutions including resolution Reichert Network Solutions GmbH, Tableau, Power BI, Looker, Zoho Analytics, Sisense, Qlik Sense, and Databox – empowering you to make data-driven decisions faster.
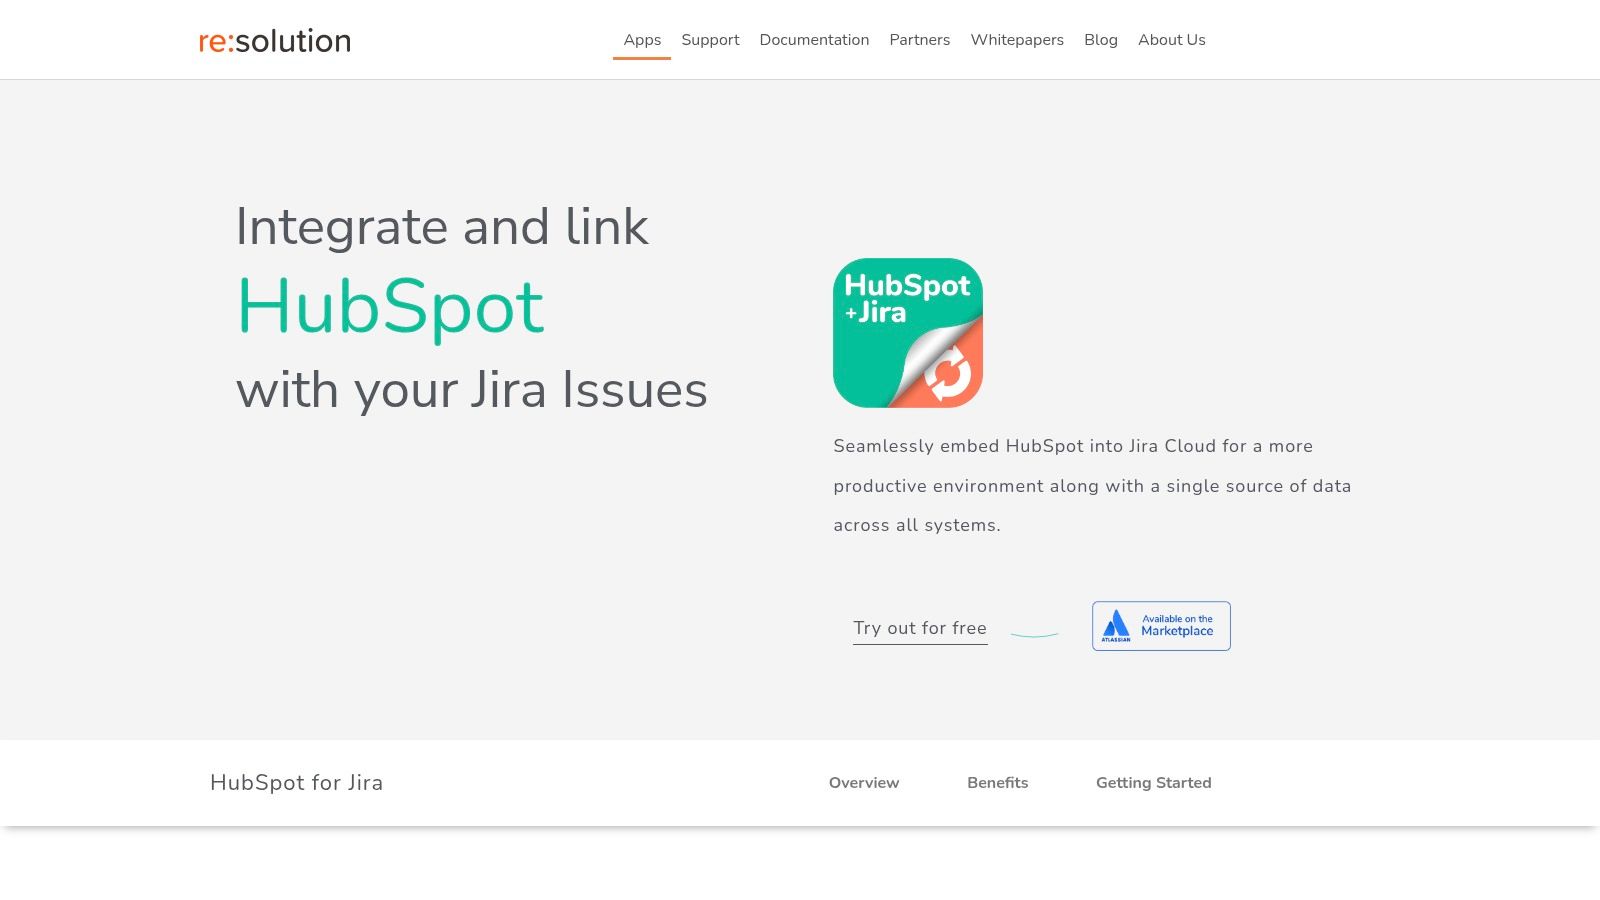
1. Hubspot for Jira: Streamlining HubSpot and Jira for Powerful Reporting Automation
For teams leveraging both HubSpot CRM and Jira for project management, accessing unified, real-time data is crucial for effective reporting automation. Resolution Reichert Network Solutions GmbH’s HubSpot for Jira app offers a robust solution to this challenge, bridging the gap between these two powerful platforms. This integration empowers teams to make data-driven decisions, improve collaboration, and ultimately enhance customer experiences. It stands out among reporting automation tools for its seamless two-way synchronization and embedded HubSpot objects within Jira, enabling quick access to crucial customer information.
This integration is especially valuable for Jira administrators, DevOps managers, sales and marketing teams, customer support agents, product managers, and data analysts who need a unified view of customer interactions and project progress. By centralizing key data points, the app facilitates more accurate and insightful reporting, leading to more informed decisions across the organization. Learn more about resolution Reichert Network Solutions GmbH for additional details about their offerings. It truly deserves its place on this list of reporting automation tools because it directly addresses the common pain point of data silos between CRM and project management systems.
Key Features and Benefits:
- Seamless Two-Way Synchronization: Real-time updates between HubSpot and Jira eliminate manual data entry and ensure consistency across platforms, providing a single source of truth for all customer-related information. This is a critical component for effective reporting automation tools as it ensures data accuracy and eliminates discrepancies.
- Embedded HubSpot Objects in Jira: Access HubSpot Contacts, Companies, Deals, and Tickets directly within Jira issues, providing context and eliminating the need to switch between platforms. This streamlines workflows and saves valuable time. Imagine having all relevant customer data at your fingertips while working on a Jira issue – this is the power of this integration.
- Enhanced Cross-Platform Communication: In-issue comments synchronize between HubSpot and Jira, fostering seamless communication between teams, from sales and support to development. This level of transparency is invaluable for collaborative projects and efficient problem-solving.
- Customizable Reporting Dashboards: Visualize the impact of Jira issues on customer relationships and prioritize tasks based on data-driven insights. This feature makes the HubSpot for Jira app a powerful reporting automation tool. Tailor dashboards to your specific needs and gain a deeper understanding of the connections between customer interactions and project development.
- Simplified Setup and Configuration: Install easily from the Atlassian Marketplace and configure user permissions intuitively, ensuring a smooth and efficient deployment process.
Pros:
- Seamless two-way synchronization of HubSpot CRM and Jira Cloud data ensures real-time updates and a single source of truth.
- Embedding HubSpot objects (Contacts, Companies, Deals, Tickets) directly inside Jira issues provides immediate access to essential customer information.
- Cross-platform communication through in-issue comments improves collaboration between sales, support, and development teams.
- Customizable reporting dashboards enable data-driven prioritization and visualization of how Jira issues impact customer relationships.
- Easy to install and configure via Atlassian Marketplace with intuitive user permission setup.
Cons:
- Pricing details are not explicitly provided upfront, which may require contacting resolution Reichert or evaluating via a free trial to understand cost implications.
- Users without a HubSpot license may have limited access to CRM data within Jira, potentially restricting full usage for some team members.
Implementation Tips:
- Define Key Data Points: Before implementation, identify the crucial data points you need to synchronize between HubSpot and Jira to maximize the benefits of the integration for your reporting automation needs.
- Customize Workflows: Tailor your Jira workflows to incorporate the HubSpot integration for automated actions like ticket creation or status updates based on changes in HubSpot.
- Train Your Team: Ensure all relevant team members are trained on using the integrated system to fully leverage its capabilities and promote adoption.
This tool facilitates building powerful reporting automation tools by connecting your CRM and project management platforms. By integrating HubSpot and Jira, teams gain a holistic view of customer interactions and project progress, leading to improved decision-making and ultimately, better customer experiences. This integration is a significant step forward in streamlining operations and fostering data-driven strategies.
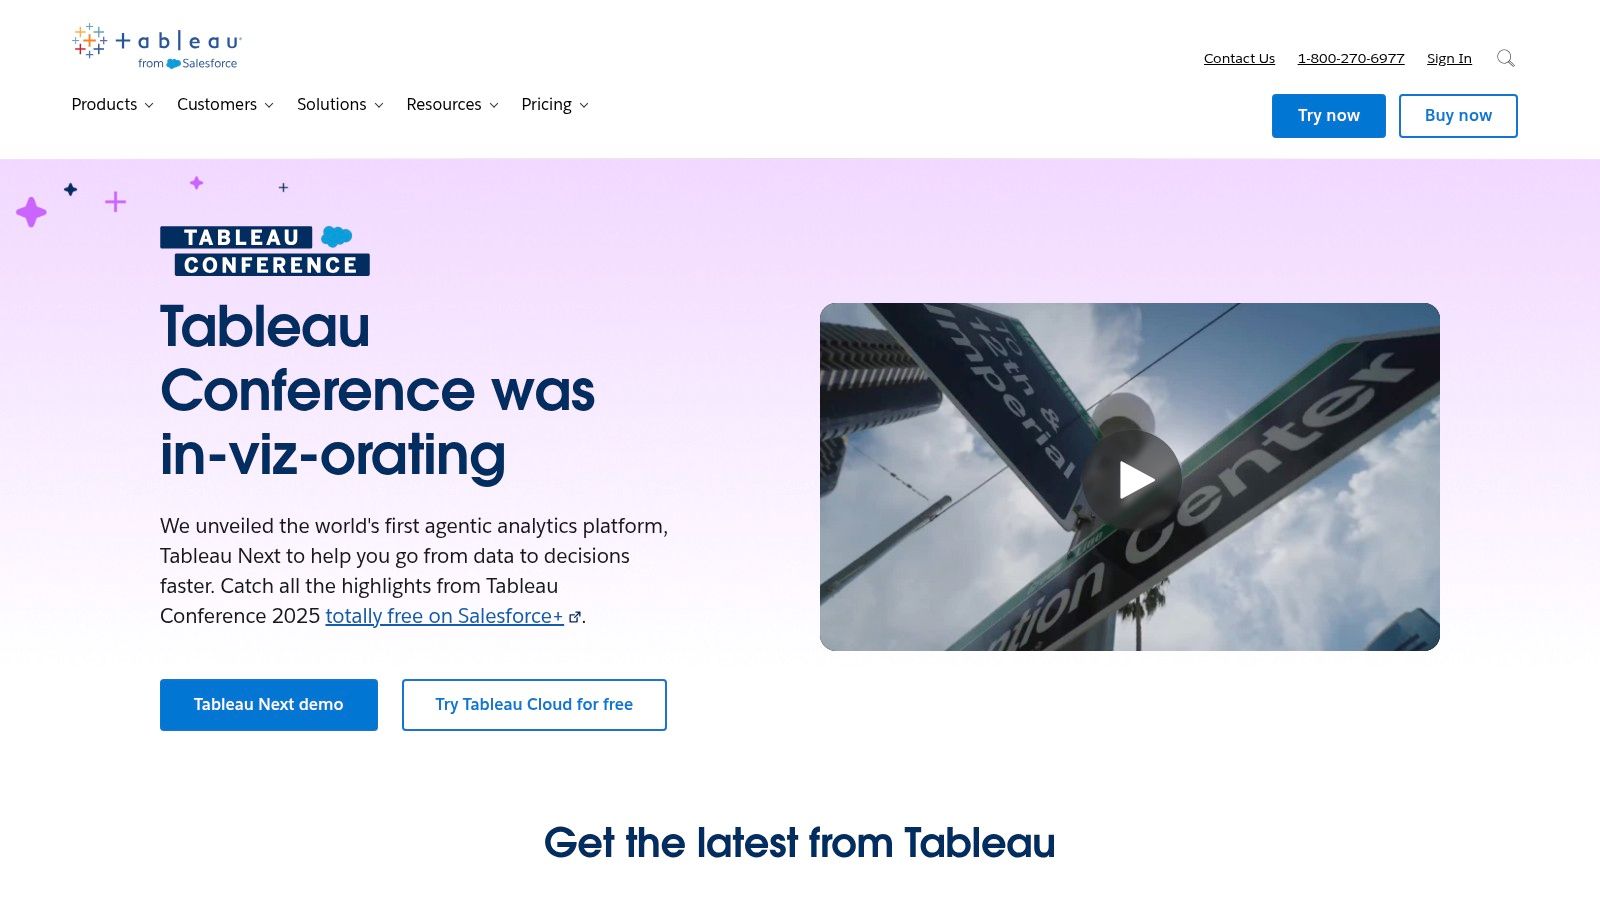
2. Tableau
Tableau stands out as a leading reporting automation tool, empowering users to transform raw data into actionable insights through interactive and shareable dashboards. Its strength lies in its ability to connect to virtually any data source, from spreadsheets and databases to cloud services, enabling the creation of dynamic visualizations with simple drag-and-drop functionality. This makes it an ideal choice for various teams, including Jira administrators needing to visualize project progress, DevOps managers tracking key metrics, and data analysts building comprehensive reports. Tableau’s automation features allow for scheduled report distribution, automated alerts based on specific parameters, and API access for embedding analytics into other platforms like HubSpot, further streamlining workflows for sales, marketing, and customer support teams.
For example, a marketing team using HubSpot can leverage Tableau to visualize campaign performance metrics pulled directly from the CRM. By creating a dashboard that automatically updates daily, they can track website traffic, lead generation, and conversion rates without manual data manipulation. Similarly, a Jira administrator can connect Tableau to their Jira instance to visualize sprint velocity, bug resolution times, and project timelines, giving them a real-time overview of project health. This ability to connect and visualize diverse data sources makes Tableau a powerful reporting automation tool for a variety of use cases.
Tableau’s reporting automation capabilities extend beyond simple visualizations. Scheduled report distribution ensures stakeholders receive timely updates without manual intervention. Parameter-driven alerts notify relevant teams when key metrics deviate from expected values, enabling proactive problem-solving. For instance, a customer support team could configure alerts for increasing ticket resolution times, allowing them to address potential bottlenecks quickly. Furthermore, its robust API enables integrating Tableau’s analytical power into other applications, such as embedding interactive dashboards into a HubSpot portal to provide sales teams with real-time customer insights.
Features:
- Interactive dashboards with drag-and-drop functionality
- Powerful data connection options to almost any data source
- Advanced visualization capabilities with automatic updates
- Scheduled report distribution and email alerts
- Mobile-friendly reports and dashboards
Pros:
- Extremely intuitive interface with minimal learning curve, making it accessible to users without extensive technical expertise.
- Robust visualization options that exceed most competitors, offering a wide range of chart types and customization options.
- Strong community and extensive learning resources, providing ample support for users of all skill levels.
- Excellent customer support.
Cons:
- Higher pricing compared to some alternatives, making it potentially less accessible for smaller businesses or teams with limited budgets.
- Can be resource-intensive for very large datasets, requiring significant processing power for optimal performance.
- Some advanced features require programming knowledge, potentially limiting customization options for non-technical users.
Pricing: Tableau offers a variety of subscription plans based on user type and functionality. Contact Tableau directly for specific pricing details.
Technical Requirements: Tableau Desktop requires a Windows or macOS operating system. Tableau Server and Tableau Online have their own specific system requirements. Consult Tableau’s documentation for detailed information.
Implementation/Setup Tips:
- Start with a clear understanding of your reporting needs and identify the key metrics you want to track.
- Connect to your relevant data sources and explore the data using Tableau’s drag-and-drop interface.
- Experiment with different visualization types to find the most effective way to represent your data.
- Utilize Tableau’s built-in templates and tutorials to accelerate your learning process.
- Leverage the extensive online community and resources for support and inspiration.
Website: https://www.tableau.com/
Tableau’s comprehensive features, intuitive interface, and powerful visualization capabilities justify its place on this list of top reporting automation tools. While its pricing might be higher than some alternatives, the benefits of its robust functionality, particularly for complex data analysis and visualization needs, make it a compelling choice for many organizations. Its seamless integration possibilities with platforms like HubSpot further enhance its value, providing a centralized platform for data-driven decision-making across different teams.
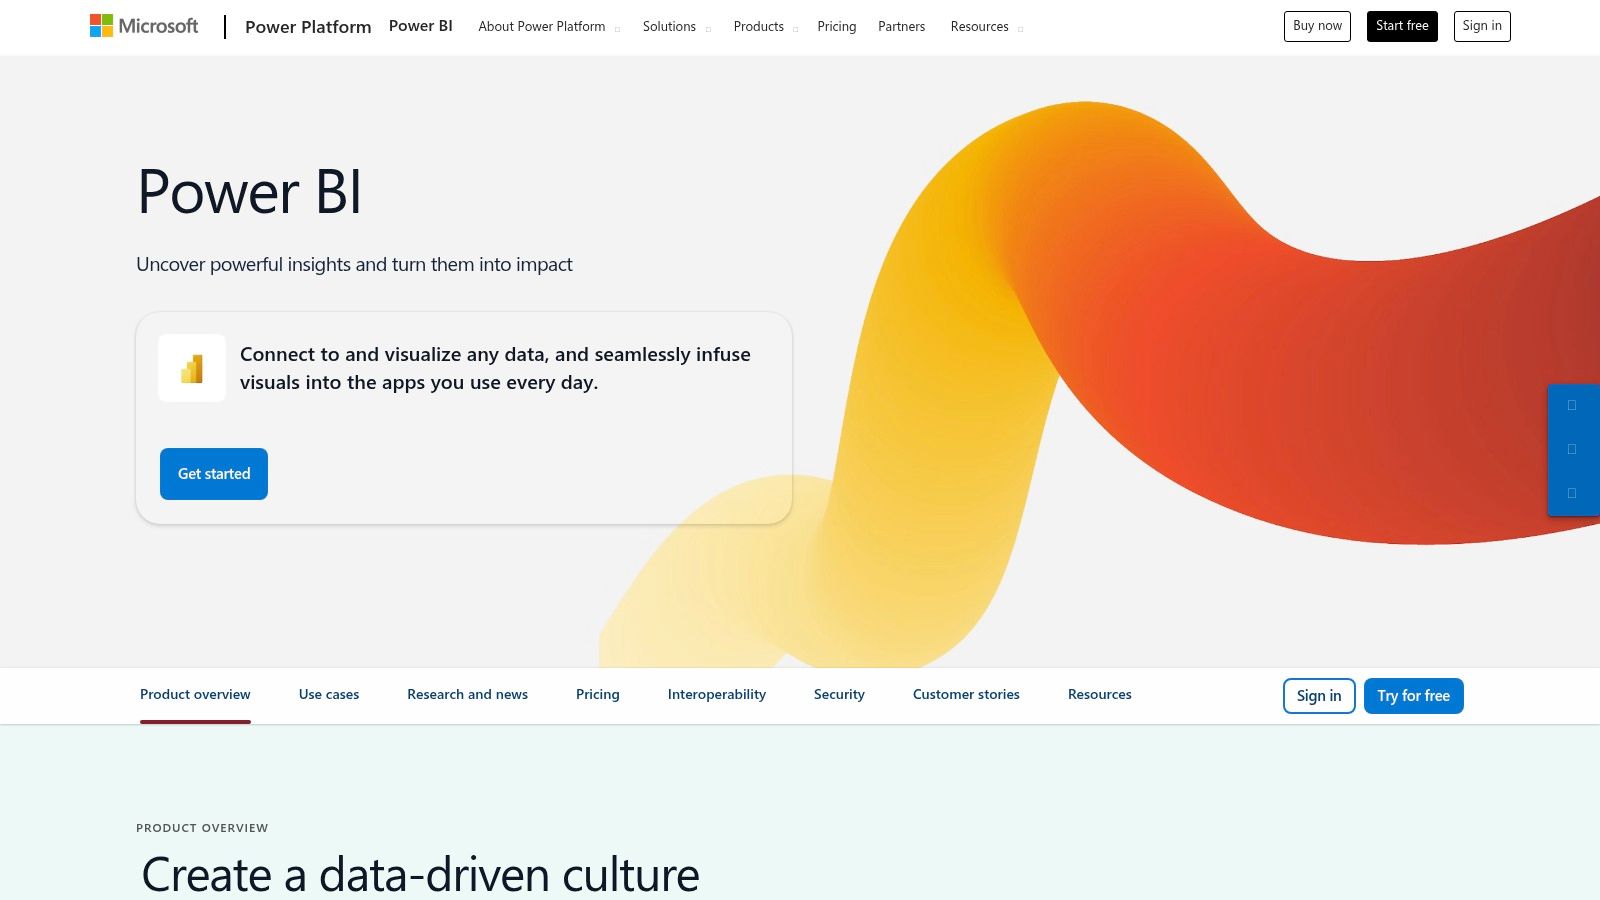
3. Power BI
Power BI is a powerful reporting automation tool that deserves a place on this list due to its robust features, tight integration with the Microsoft ecosystem, and relatively cost-effective pricing. It empowers users across various departments, from Jira administrators and DevOps managers analyzing project data to sales and marketing teams tracking HubSpot CRM performance, to create interactive and automated reports without needing extensive technical expertise. By connecting to a wide range of data sources, including Jira and HubSpot (through APIs or connectors), Power BI enables businesses to centralize their data and generate insightful reports that drive data-driven decisions. Imagine automatically generating weekly reports on sprint progress from Jira data, or visualizing HubSpot marketing campaign effectiveness without manually compiling data – Power BI makes these scenarios a reality.
Power BI’s strength lies in its ability to transform raw data into compelling visuals. Its drag-and-drop interface simplifies report creation, enabling even non-technical users to build dashboards displaying key performance indicators (KPIs). The platform supports real-time data streaming, ensuring reports are always up-to-date. This is especially useful for monitoring live project updates in Jira or tracking ongoing marketing campaign performance in HubSpot. For developers, Power BI offers embedded analytics options, allowing seamless integration of reports and dashboards into existing applications.
For example, a customer support team can leverage Power BI to automate reports on ticket resolution times, identifying bottlenecks and areas for improvement in their service processes. Product management teams can track product usage data alongside Jira development sprints to assess feature impact. Data analysts and reporting specialists benefit from Power BI’s advanced data modeling capabilities and AI-powered insights, uncovering hidden trends and making accurate predictions.
Key Features & Benefits for Reporting Automation:
- Scheduled Refreshes: Automate data updates to ensure reports always reflect the latest information. This eliminates manual data pulls and saves valuable time.
- Dataflows: Create reusable data pipelines that cleanse, transform, and prepare data for reporting. This ensures data consistency and accuracy across different reports.
- AI-Powered Insights: Utilize natural language queries and AI-powered algorithms to uncover trends and patterns in your data that might otherwise be missed.
- Integration with Microsoft Ecosystem: Seamlessly connect to other Microsoft tools like Excel, Azure, and Dynamics 365, streamlining data sharing and analysis.
Pricing and Technical Requirements:
Power BI offers a tiered pricing model, including a free version with limited functionality, a Pro version for individual users, and a Premium version for enterprise-wide deployment. The Premium tier unlocks advanced features like larger data capacities and enhanced collaboration capabilities. Technical requirements are minimal, primarily requiring a web browser and an internet connection. For advanced data modeling and integration, some familiarity with SQL and data warehousing concepts can be beneficial.
Comparison with Similar Reporting Automation Tools:
Compared to other reporting automation tools like Tableau and Qlik Sense, Power BI stands out with its cost-effectiveness and deep integration with the Microsoft ecosystem. While Tableau offers more advanced visualization capabilities for complex data scenarios, Power BI provides a more accessible entry point for users familiar with Microsoft products. Qlik Sense, like Power BI, emphasizes self-service BI, but its licensing model can be more complex.
Implementation and Setup Tips:
- Identify your key reporting needs: Define the specific metrics and insights you want to track.
- Connect to your data sources: Establish connections to Jira, HubSpot, and other relevant data sources using APIs or connectors.
- Create your data model: Define the relationships between your data sources to enable accurate analysis.
- Build your reports and dashboards: Use the drag-and-drop interface to visualize your data and create interactive dashboards.
- Schedule automated refreshes: Set up automated data refreshes to ensure your reports are always up-to-date.
- Share your reports: Distribute your reports to stakeholders through various channels, including embedded dashboards and exported reports.
Pros:
- Cost-effective compared to many enterprise solutions
- Frequent updates and new features
- Familiar interface for Microsoft users
- Strong security and governance features
Cons:
- Some advanced features only available in Premium tier
- Can be complex for beginners to master fully
- Limited functionality in the free version
Website: https://powerbi.microsoft.com/
4. Looker (Google Cloud)
Looker (Google Cloud) is a robust business intelligence and big data analytics platform that empowers companies to explore, analyze, and share real-time business analytics. This powerful reporting automation tool goes beyond basic dashboards, offering a sophisticated approach to data analysis that’s particularly well-suited for complex data environments. For Jira administrators and DevOps managers dealing with intricate project data, sales and marketing teams leveraging HubSpot insights, and data analysts seeking in-depth reporting capabilities, Looker provides a comprehensive solution.
Its proprietary modeling language, LookML, is a key differentiator. LookML allows data teams to define complex relationships within their database, creating a consistent and reliable source of truth. This enables business users, including customer support agents and product managers, to perform self-service analytics without needing to write complex SQL queries, saving valuable time and resources. Learn more about Looker (Google Cloud) This self-service functionality contributes significantly to improved reporting automation. Looker’s automation features, including scheduled data deliveries and alerts, further streamline reporting workflows, allowing teams to focus on insights rather than manual report generation. Through its extensive API, Looker can also integrate with various other tools, expanding its potential for comprehensive reporting automation.
For those considering reporting automation tools, Looker offers a particularly strong solution for complex data scenarios. Imagine a DevOps manager wanting to correlate Jira issue data with system performance metrics. Looker can seamlessly join data from multiple sources, like Jira and monitoring tools, to provide a holistic view of project health and identify bottlenecks. Similarly, sales and marketing teams using HubSpot can integrate that data with other sources, such as website analytics or product usage data, to gain deeper insights into customer behavior and campaign effectiveness.
Features:
- LookML modeling language for powerful data definitions
- Embedded analytics capabilities
- Extensive API for custom integrations
- Cross-database joins and merged results
- Git integration for version control
Pros:
- Excellent for companies with complex data models
- Strong governance and data consistency
- Enables true self-service analytics
- Seamless Google Cloud integration
Cons:
- Steeper learning curve for LookML
- Higher price point for smaller organizations
- Requires more technical expertise than some alternatives
While pricing information isn’t readily available, Looker is generally considered a higher-end solution best suited for medium to large organizations. The investment in LookML training and potentially dedicated data engineering resources is important to consider. However, for organizations dealing with complex data and requiring robust self-service analytics, Looker provides a powerful platform for comprehensive reporting automation.
Implementation Tips:
- Start with a well-defined data model. Invest time in understanding your data sources and relationships before building your LookML model.
- Leverage Looker’s training resources and community support to get up to speed with LookML.
- Consider a phased rollout, starting with a pilot project to demonstrate value and refine your approach.
Looker earns its spot on this list because it tackles the complexities of reporting automation head-on. By providing a structured approach to data modeling and empowering self-service analytics, Looker transforms how organizations access and utilize their data. While the initial learning curve and cost may be higher than some other tools, the long-term benefits in terms of efficiency, data consistency, and deeper insights make it a worthwhile investment for organizations seeking robust reporting automation. If you’re grappling with intricate data relationships and need a tool that can empower your entire organization with data-driven decision making, Looker is a reporting automation tool worth exploring.
5. Zoho Analytics: A Reporting Automation Tool Powerhouse for Zoho Users
Zoho Analytics earns its place on this list of top reporting automation tools due to its impressive blend of user-friendliness, powerful features, and tight integration within the Zoho ecosystem. For businesses already leveraging Zoho CRM, Zoho Projects, or other Zoho applications, Zoho Analytics provides a seamless reporting and analytics solution, eliminating the need for complex data integrations. It’s a particularly strong choice for small to medium-sized businesses looking for comprehensive reporting without the hefty price tag of enterprise-grade solutions. This platform empowers teams, from Jira administrators and DevOps managers to sales and marketing teams using HubSpot and customer support agents, to gain data-driven insights effortlessly.
Zoho Analytics Dashboard Example
Zoho Analytics shines as a reporting automation tool by enabling automated report generation and distribution. Imagine automatically sending weekly sales reports to your team, or monthly marketing performance dashboards to stakeholders, all without lifting a finger. This automation frees up valuable time for more strategic tasks. Furthermore, the platform’s visual drag-and-drop interface makes it easy for even non-technical users to create insightful reports and dashboards.
Key Features and Benefits for Reporting Automation:
- AI-powered Assistant (Zia): Leverage the power of AI to generate reports using natural language queries. Simply ask Zia a question like, “What were our top selling products last quarter?” and receive a customized report in seconds. This is particularly beneficial for users who may not be familiar with complex reporting tools.
- Automated Report Scheduling and Distribution: Schedule reports to be generated and distributed automatically at specified intervals (daily, weekly, monthly). Customize the distribution list and format (PDF, Excel, CSV) to meet your specific needs. This ensures timely delivery of critical information to the right people.
- Cross-Functional Dashboards: Combine data from multiple sources, including various Zoho applications and external databases, to create comprehensive dashboards that provide a holistic view of your business performance. This empowers data analysts and reporting specialists to derive deeper insights.
- White-labeled Embedded Analytics: Embed interactive dashboards and reports into your own applications or websites, providing valuable insights to your customers or partners. This feature enhances the value of your product offerings.
- User-Friendly Interface: Zoho Analytics is designed for ease of use, requiring minimal training for users to get started. Its intuitive drag-and-drop interface simplifies report creation and customization.
Pros and Cons:
Pros:
- Excellent Value: Zoho Analytics offers a competitive pricing model that is particularly attractive to small and medium-sized businesses.
- Seamless Zoho Integration: Integrates flawlessly with other Zoho applications, streamlining data flow and reporting processes.
- User-Friendly Interface: Easy to learn and use, even for non-technical users.
- Robust Sharing and Collaboration: Facilitates easy sharing and collaboration on reports and dashboards.
Cons:
- Limited Advanced Analytics: May not offer the depth of advanced analytics features found in some enterprise-level solutions.
- Fewer Data Connectors: While it integrates well with Zoho products, it may have fewer connectors to external data sources compared to premium alternatives.
- Mobile Experience: While mobile access is available, the experience may not be as robust as the desktop version.
Pricing and Technical Requirements:
Zoho Analytics offers a variety of pricing plans to fit different business needs, starting with a free version for basic usage. Paid plans offer increased features and user capacity. Detailed pricing information can be found on the Zoho Analytics website. Technical requirements are minimal, primarily requiring a web browser for access.
Implementation and Setup Tips:
- Start with a Clear Objective: Define your reporting goals before diving into implementation. What key metrics do you need to track? Who needs access to the reports?
- Leverage Pre-built Templates: Zoho Analytics offers a library of pre-built templates that can be customized to fit your specific needs, accelerating the setup process.
- Explore Zia’s Capabilities: Experiment with Zia’s natural language processing to quickly generate reports and gain insights without needing to manually configure reports.
- Connect Relevant Data Sources: Integrate Zoho Analytics with your essential data sources, including Zoho CRM, marketing automation platforms, and other relevant systems.
Comparison with Similar Tools:
While Zoho Analytics shines within the Zoho ecosystem, other reporting automation tools like Power BI and Tableau offer more advanced analytics features and broader data connector options. However, they often come with a higher price tag. For businesses heavily invested in the Zoho suite, Zoho Analytics provides a more integrated and cost-effective solution.
Website: https://www.zoho.com/analytics/
Zoho Analytics is a powerful reporting automation tool that simplifies the process of generating and distributing insightful reports and dashboards. Its seamless integration with the Zoho suite, combined with its user-friendly interface and AI-powered assistant, makes it a valuable asset for businesses looking to improve their data-driven decision-making.
6. Sisense
Sisense is a powerful end-to-end business intelligence (BI) and reporting automation tool that empowers users to prepare, analyze, and visualize complex datasets from various sources. This robust platform is particularly well-suited for organizations dealing with large volumes of data, thanks to its unique In-Chip technology and ElastiCube analytical database. These technologies enable high-performance analytics even on standard hardware, making Sisense a compelling option for those seeking efficient reporting automation tools. It caters to diverse user groups, from data analysts and reporting specialists seeking advanced analytics to sales and marketing teams requiring automated HubSpot reporting integrations.

Sisense earns its place on this list due to its robust automation capabilities. These include scheduled reports, custom alerts based on data thresholds, and an extensive API that facilitates embedded analytics and custom integrations. This makes it particularly appealing for Jira administrators and DevOps managers seeking to streamline their reporting workflows, or for product and project management teams looking to automate progress updates. For instance, imagine automating a weekly report that shows the status of all Jira issues related to a specific HubSpot deal. This automation frees up valuable time and ensures that everyone has access to the most up-to-date information. Learn more about Sisense. Customer support and service agents can also benefit from automated reports on customer satisfaction metrics pulled from both HubSpot and Jira Service Desk.
For software developers, Sisense’s white-label embedding capabilities allow for seamless integration of its analytics features into OEM solutions. This allows for the creation of custom reporting dashboards tailored to specific business needs. Additionally, Sisense offers AI-powered insights and anomaly detection, which can be invaluable for identifying trends and potential issues within your data.
While Sisense offers numerous advantages for reporting automation tools, it’s essential to consider its drawbacks. The platform’s pricing is higher than many competitors, and the initial setup and implementation can be complex, requiring technical expertise. Less technical users may find the interface less intuitive than some alternative BI tools.
Key Features and Benefits for Reporting Automation:
- In-Chip Technology: Enables rapid processing of large datasets, essential for organizations dealing with high data volumes.
- Drag-and-Drop ETL: Simplifies data preparation and transformation, even for non-technical users.
- Customizable Dashboards and Visualizations: Offers a high degree of flexibility in how data is presented and analyzed.
- Automated Reporting and Alerting: Allows for the creation of scheduled reports and custom alerts, freeing up time and ensuring timely insights.
- Extensive API and Embedding Capabilities: Provides developers with the tools to integrate Sisense into other applications and create custom solutions.
Pros:
- Exceptional performance with large and complex datasets.
- Highly customizable dashboards and visualizations.
- Robust embedding capabilities for software developers.
- Effective handling of data from disparate sources.
Cons:
- Higher price point compared to some competitors.
- Setup and implementation can be complex.
- Steeper learning curve for non-technical users.
Comparison with Similar Tools: While tools like Tableau and Power BI offer similar functionalities, Sisense differentiates itself with its In-Chip technology, which provides a significant performance advantage for large datasets. However, Tableau and Power BI might be more suitable for smaller organizations or those with less technical expertise.
Implementation Tips:
- Start with a clear definition of your reporting needs and objectives.
- Engage with Sisense’s professional services or consulting partners for assistance with complex implementations.
- Utilize the extensive online documentation and training resources available.
By understanding the strengths and weaknesses of Sisense, organizations can determine if it’s the right reporting automation tool to meet their specific requirements. Its robust features and performance capabilities make it a compelling choice for those seeking to unlock the full potential of their data.
7. Qlik Sense
Qlik Sense stands out among reporting automation tools for its unique associative data model, which allows users to explore data freely and uncover hidden relationships. Unlike query-based tools that restrict exploration to predefined paths, Qlik Sense maintains all data relationships, enabling a more comprehensive analysis. This is particularly valuable for teams seeking deeper insights and a more flexible approach to reporting. For example, a sales and marketing team using HubSpot could leverage Qlik Sense to analyze campaign performance alongside customer behavior data from other sources, uncovering unexpected correlations that inform future strategies. Similarly, customer support agents can analyze support tickets in Jira alongside customer demographics and purchase history, identifying patterns that contribute to improved service. This powerful associative engine makes Qlik Sense a valuable asset for any team seeking to leverage data for better decision-making.
Qlik Sense offers a robust suite of features specifically designed for reporting automation. Its NPrinting functionality allows for pixel-perfect report generation in multiple formats, including PDF, Excel, and PowerPoint. This automation capability ensures consistent branding and formatting across all reports. Scheduled report distribution and automated alerts ensure that stakeholders receive timely insights without manual intervention. These features are particularly beneficial for Jira administrators and DevOps managers who need regular updates on project progress and performance metrics. Product and project management teams also benefit from automated reports on product usage and customer feedback, allowing for data-driven product development.
Key Features and Benefits:
- Associative Data Model: Explore the full complexity of your data and uncover hidden relationships.
- AI-Assisted Analysis: Augmented intelligence capabilities with Insight Advisor provide data-driven suggestions and insights.
- NPrinting: Generate pixel-perfect reports in various formats automatically.
- Scheduled Distribution and Alerts: Automate the delivery of reports and notifications to key stakeholders.
- Self-Service Data Preparation: Empower users to prepare and analyze data without extensive technical expertise.
- Robust Data Governance: Maintain data quality and compliance with robust lineage capabilities.
- Scalability: Effectively scales from small teams to large enterprise deployments.
- Strong Security: Ensure data security and compliance with industry standards.
Pros:
- Powerful Insights: The associative engine allows for a deeper exploration of data and the discovery of hidden insights.
- Comprehensive Data Governance: Ensures data quality, consistency, and compliance.
- Scalability: Adapts to the needs of organizations of all sizes.
- Robust Security: Protects sensitive data with strong security features and compliance tools.
Cons:
- Learning Curve: Can be more complex to learn than some other reporting automation tools.
- Pricing: Premium features may require a higher investment.
- Setup and Administration: Initial setup and ongoing administration can be complex.
Pricing and Technical Requirements:
Qlik Sense offers various pricing tiers based on user needs and deployment size. Contact Qlik directly for detailed pricing information. Technical requirements vary depending on the deployment option (cloud or on-premise). Detailed technical specifications are available on the Qlik website.
Comparison with Similar Tools:
While tools like Tableau and Power BI offer robust reporting and visualization capabilities, Qlik Sense differentiates itself with its associative data model, allowing for a more flexible and exploratory approach to data analysis. This is particularly advantageous for uncovering hidden relationships and gaining a deeper understanding of complex data sets.
Implementation and Setup Tips:
- Start Small: Begin with a specific use case and gradually expand usage as your team becomes more familiar with the platform.
- Leverage Training Resources: Qlik offers a range of training materials to help users get up to speed quickly.
- Engage with the Qlik Community: Connect with other users and experts to share best practices and troubleshoot issues.
Why Qlik Sense Deserves Its Place on this List:
Qlik Sense’s associative data model and powerful automation features make it a valuable tool for organizations seeking deep insights and efficient reporting workflows. Its ability to uncover hidden relationships and automate the delivery of reports across various formats makes it a strong contender for any team looking to improve data-driven decision-making. While the learning curve and cost may be higher than some alternatives, the potential for uncovering valuable insights makes Qlik Sense a worthwhile investment for many organizations.
Website: https://www.qlik.com/us/products/qlik-sense
8. Databox
Databox earns its spot on this list of top reporting automation tools because it excels at simplifying KPI tracking and reporting for small to medium-sized businesses, particularly those focused on marketing. It acts as a central hub, pulling data from various sources and presenting it in an easy-to-understand format, making it ideal for teams needing a quick overview of their performance. For Jira administrators, DevOps managers, sales and marketing teams using HubSpot, or anyone struggling to wrangle data from multiple platforms, Databox offers a refreshing, streamlined approach. It offers a practical solution for automating your reporting workflows, freeing up valuable time and resources.
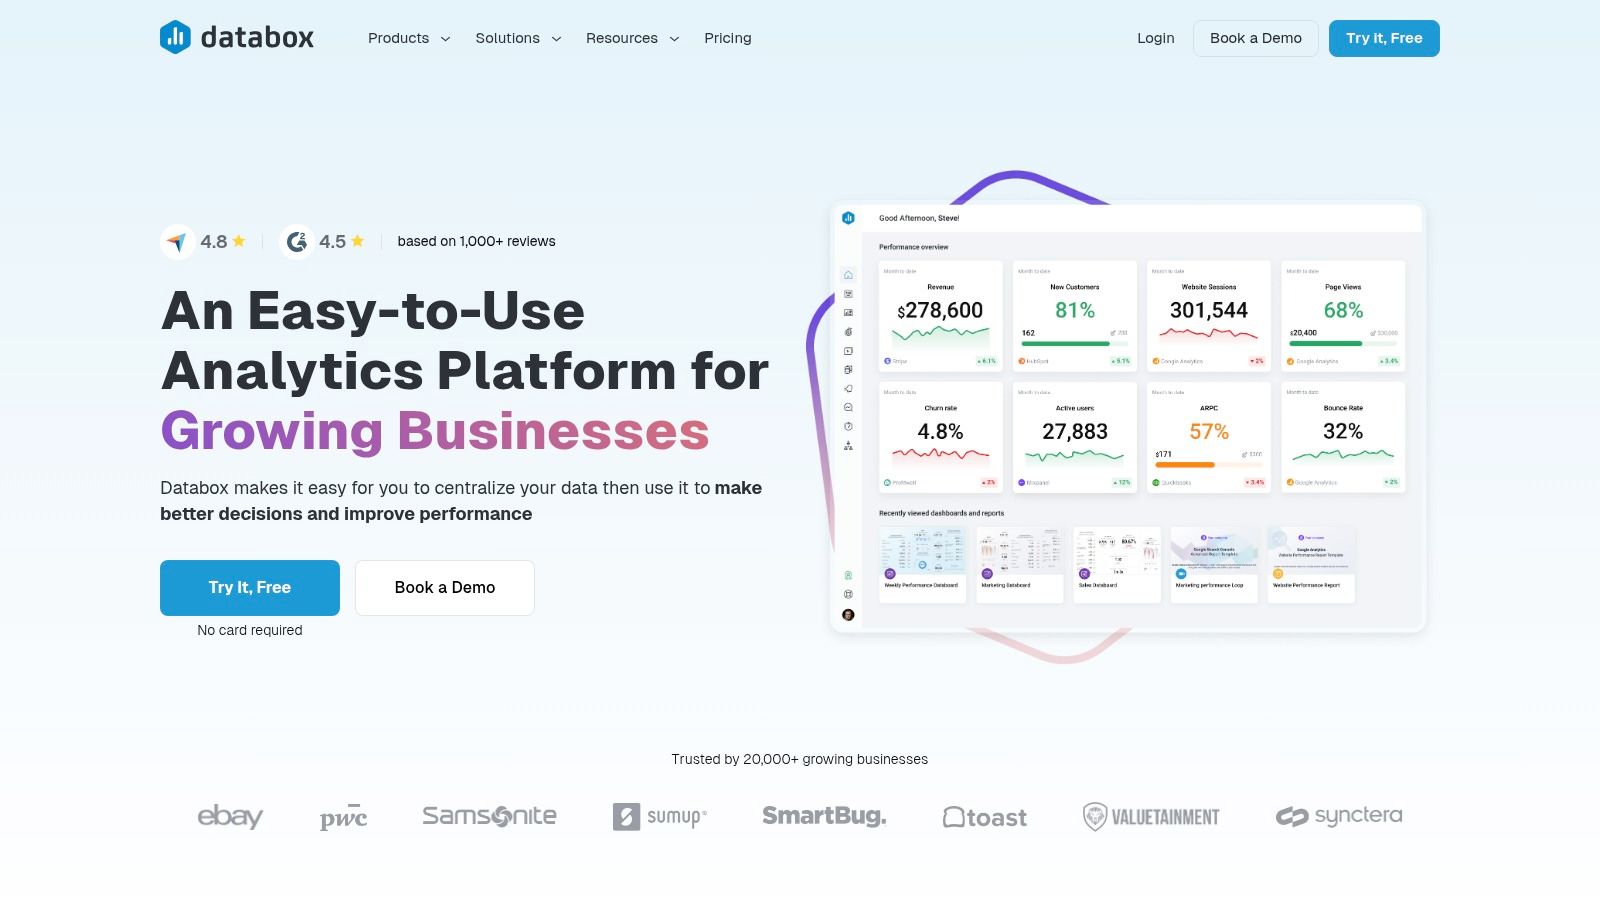
Consider a marketing team using HubSpot alongside other tools like Google Analytics and Facebook Ads. Manually compiling reports from these disparate sources is time-consuming and error-prone. Databox automates this process by connecting to these platforms, extracting the relevant data, and presenting it in customizable dashboards. This allows the team to quickly monitor campaign performance, track key metrics, and identify areas for improvement without getting bogged down in manual data manipulation. Similarly, customer support teams can monitor key metrics like ticket resolution time and customer satisfaction scores from their helpdesk software, offering valuable insights into team performance and customer experience. Product and project management teams can leverage Databox to track progress against milestones, identify bottlenecks, and ensure projects stay on track.
Databox’s pre-built dashboard templates allow for rapid implementation, making it an attractive option for those seeking quick wins with reporting automation tools. Its mobile-first design also caters to the needs of today’s on-the-go workforce. While powerful solutions like Tableau or Power BI offer advanced data manipulation and visualization capabilities, Databox’s simplicity and user-friendly interface make it a strong contender for less technically inclined users seeking readily available insights.
Key Features and Benefits:
- Pre-built dashboard templates: Jumpstart your reporting with ready-made templates for various use cases.
- Automated Scorecards: Receive daily, weekly, or monthly performance snapshots delivered directly to your inbox or mobile device.
- Goal Tracking & Alerts: Set targets for key metrics and receive notifications when goals are met or missed, allowing for proactive adjustments.
- Mobile-First Design: Access your data and reports on the go with dedicated mobile apps for iOS and Android.
- Custom Metric Calculations: Tailor your reporting by creating custom metrics based on your specific needs.
Pros:
- Exceptionally user-friendly interface: Easy to navigate and customize, even for non-technical users.
- Quick implementation: Minimal setup time allows you to start tracking KPIs almost immediately.
- Affordable pricing: Suitable for small to medium businesses with budget constraints.
- Strong focus on KPI monitoring and goal tracking: Helps businesses stay focused on their most important metrics.
Cons:
- Limited data transformation capabilities: Not ideal for complex data analysis or manipulation.
- Fewer advanced visualization options: May not satisfy the needs of users requiring highly customized visualizations.
- Not designed for large data volumes: Better suited for smaller datasets and less complex reporting needs.
Pricing: Databox offers a free plan with limited features and paid plans starting at $72/month.
Technical Requirements: Databox is a cloud-based platform accessible through a web browser or mobile app. It integrates with a wide range of data sources through pre-built connectors.
Implementation Tips:
- Start with a specific goal: Define the KPIs you want to track and the insights you hope to gain.
- Utilize pre-built templates: Leverage existing templates to quickly create dashboards and scorecards.
- Connect your key data sources: Integrate Databox with the platforms where your data resides.
- Customize your dashboards: Tailor the layout and visualizations to suit your specific needs.
- Set up alerts and notifications: Stay informed of progress towards your goals.
Website: https://databox.com/
By focusing on ease of use and streamlined reporting, Databox provides a compelling alternative to more complex reporting automation tools. Its affordability and quick implementation make it a valuable asset for smaller businesses and teams seeking to gain actionable insights from their data without extensive technical expertise. For those seeking a simple yet powerful solution for KPI tracking and reporting, Databox is definitely worth considering.
Reporting Automation Tools Comparison
| Product | Core Features/Capabilities | User Experience & Quality ★★★★☆ | Value Proposition 💰 | Target Audience 👥 | Unique Selling Points ✨ | Price Points 💰 |
|---|---|---|---|---|---|---|
| 🏆 resolution Reichert Network Solutions GmbH | Two-way HubSpot & Jira sync, embed CRM objects in Jira | Real-time updates, cross-platform comments | High productivity & collaboration | Jira admins, sales, support, marketing, dev teams | Deep CRM-Jira integration, customizable dashboards | Not publicly disclosed |
| Tableau | Interactive dashboards, broad data source connections | Intuitive drag-drop UI, strong visuals ★★★★★ | Industry-leading BI & visualization | BI professionals, data analysts, enterprises | Extensive visualization, strong community support | Premium pricing |
| Power BI | Microsoft ecosystem integration, AI insights | Familiar MS UI, frequent updates ★★★★☆ | Cost-effective MS-aligned BI | Microsoft users, enterprises, data professionals | AI-powered insights, real-time streaming | Affordable, premium tiers exist |
| Looker (Google Cloud) | LookML modeling, embedded analytics, API integrations | Powerful but steep learning curve ★★★☆☆ | Complex data model governance | Technical data teams, enterprises | Custom data modeling language, Google Cloud integration | Higher price, enterprise focused |
| Zoho Analytics | AI assistant (Zia), cross-source dashboards, automation | User-friendly, easy setup ★★★★☆ | Great SMB value | Small-medium businesses, Zoho ecosystem users | AI natural language reports, Zoho suite integration | Affordable |
| Sisense | In-Chip tech, drag-drop ETL, AI insights | Powerful analytics, performance ★★★★☆ | High-performance BI for complex data | Tech-savvy teams, enterprises | Proprietary accelerated processing tech, embedding | Higher price |
| Qlik Sense | Associative engine, AI insights, NPrinting reports | Robust, scalable, complex ★★★★☆ | Enterprise-grade flexible analytics | Enterprises, security-conscious organizations | Associative analytics, strong governance | Premium pricing |
| Databox | Pre-built templates, KPI tracking, mobile-first | Very user-friendly, fast setup ★★★★☆ | Affordable KPI dashboards | SMBs, marketing teams | Focused KPI monitoring, goal tracking | Budget-friendly |
Supercharge Your Reporting with the Right Automation Tools
From streamlining data collection and analysis to generating visually appealing reports, the right reporting automation tools can revolutionize your workflows. This article explored a range of powerful solutions, from established platforms like Tableau and Power BI to specialized tools like Zoho Analytics and Databox, and even delved into the capabilities of Looker within the Google Cloud ecosystem. We also highlighted the potential of resolution Reichert Network Solutions GmbH for integrating Jira with platforms like HubSpot. Each tool offers unique strengths catering to diverse needs and technical expertise. Remember, the core benefit of leveraging these tools lies in unlocking the potential of your data to gain actionable insights, improve decision-making, and significantly boost efficiency across your teams, whether they’re in Jira, HubSpot, or other platforms.
Key takeaways include the importance of aligning your reporting automation strategy with your specific business goals and the need for seamless integration between your chosen tool and existing systems. Consider factors such as data sources, visualization capabilities, ease of use, and scalability when making your selection. For those working with HubSpot and Jira, a robust integration is crucial for streamlining workflows and gaining a holistic view of customer interactions and project progress. For example, understanding your marketing attribution can be key to understanding which campaigns contribute most to lead generation and conversions. For a deeper dive into attribution and how it can inform your reporting automation, check out this comprehensive list of the top attribution tools available: Best Marketing Attribution Tools
To choose the best reporting automation tool for your needs, start by defining your reporting objectives. Identify your key performance indicators (KPIs) and the data sources required to track them. Then, evaluate the features and functionalities of each tool against your specific requirements. Consider factors like real-time reporting capabilities, customizability, and integration options with your existing tech stack. Don’t forget the importance of user adoption – a tool is only effective if your team can easily use it. Proper implementation and training are crucial for maximizing the value of your chosen solution.
By taking a strategic approach to selecting and implementing reporting automation tools, you empower your teams to work smarter, not harder. Free up valuable time and resources to focus on strategic initiatives, while gaining a deeper understanding of your business performance. Ready to streamline your reporting and boost your productivity? Explore resolution Reichert Network Solutions GmbH (resolution Reichert Network Solutions GmbH) to connect your HubSpot CRM and Jira instances for powerful two-way data synchronization. This integration allows you to automate reporting, enhance cross-team collaboration, and unlock valuable insights into your customer journey and project progress.
