
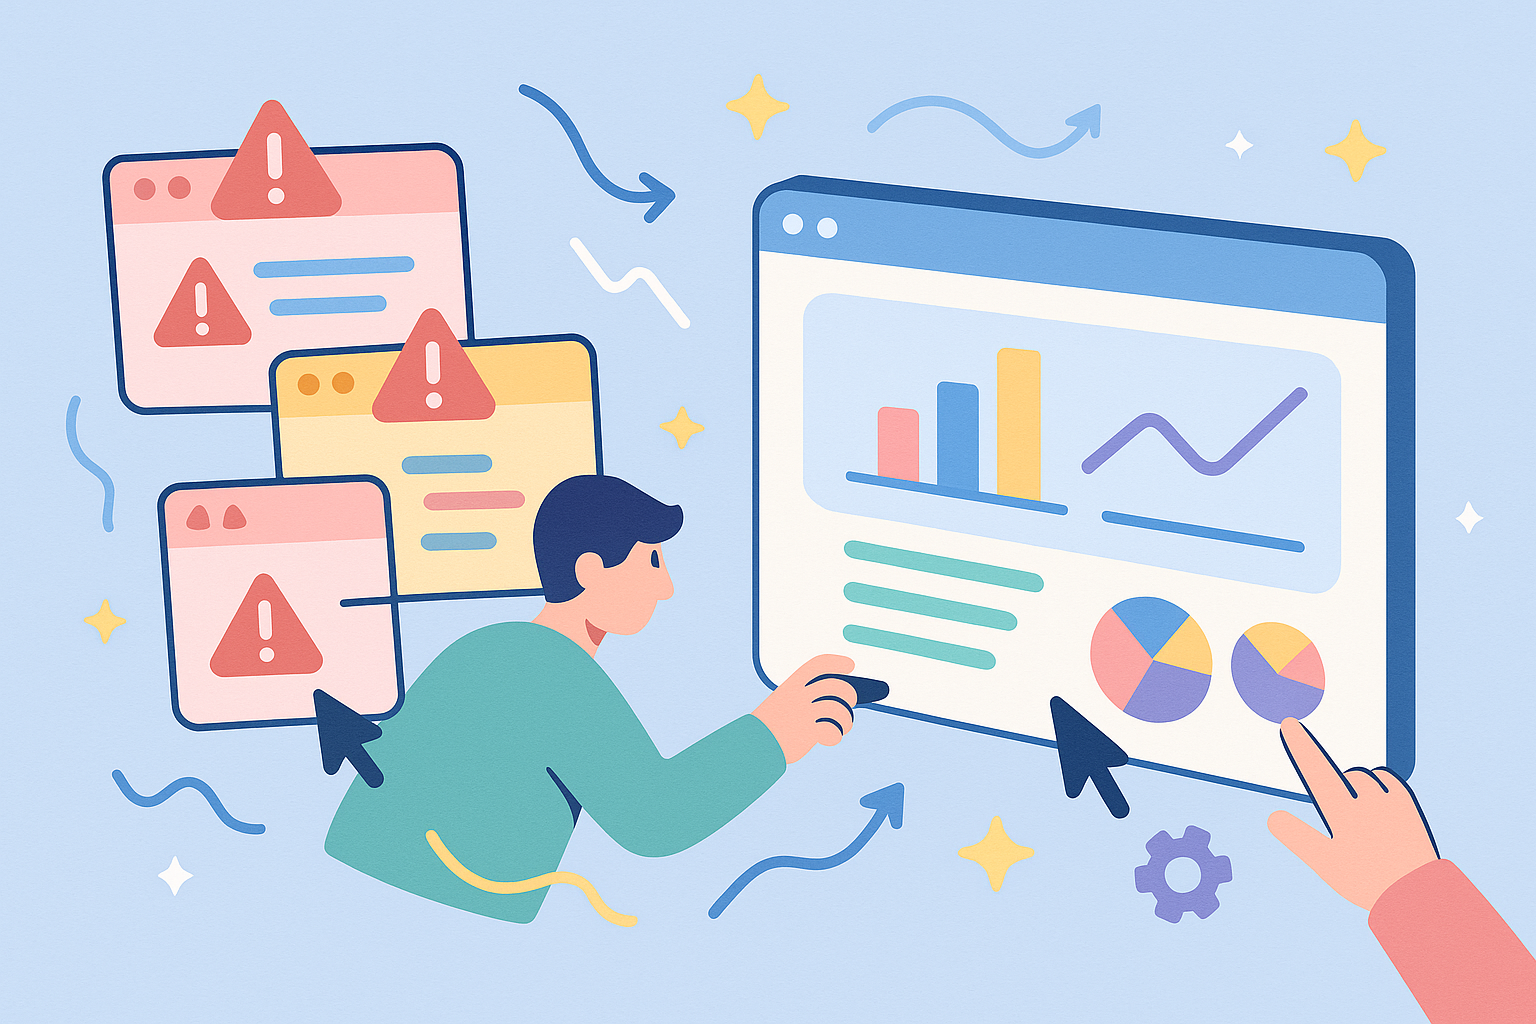
Why Your Team's Reporting Pain Is Real (And Fixable)
You know that feeling when stakeholders ask for a project update, and you suddenly find yourself frantically clicking through Jira screens? It's a common pain point. So many teams are drowning in data but can't seem to find the insights they need. They're burning precious hours manually compiling information that should be readily available. Talking to product managers and team leads, I've noticed a recurring theme: reporting chaos.
This chaos often translates to missed deadlines, frustrated stakeholders, and teams that feel constantly behind. The old-school method of screenshot-driven status updates just doesn't cut it. It creates more problems than it solves, and teams end up feeling like they're always playing catch-up. Why? Because piecing together a coherent narrative from scattered Jira screens is like trying to build a puzzle without the picture on the box.
Generating reports in Jira effectively isn't just a best practice; it's a real competitive advantage. Good reporting changes the whole project dynamic. Instead of reactive scrambling, teams can proactively identify roadblocks, anticipate stakeholder needs, and actually demonstrate the value of their work. This shift lets teams concentrate on what matters: delivering results. Jira reporting gives you a comprehensive view of project progress and issue trends. For example, reports like the Average Age Report and Resolution Time Report help teams spot bottlenecks.
Since 2025, Jira has even included reports like the Created vs. Resolved Issues Chart, providing even deeper insights. Want to learn more about custom reports in Jira? Check out this helpful guide: Jira Custom Reports: Full Guide.
Effective Jira reporting isn't just about data; it's about telling a story. It's about connecting the dots between the technical tasks and the bigger business outcomes, showing stakeholders how their investment translates into tangible progress. If capacity planning is on your mind, this might be helpful: Jira Capacity Planning. The real hurdles your team faces aren't usually technical; they're process-related. In the next sections, we'll explore how to overcome these challenges and unlock the full potential of Jira reporting.
Building Dashboards That Tell Your Project's Story
Forget those dense, complicated Jira dashboard tutorials. Let's talk about building dashboards you'll actually use every day. Whether you're giving execs the big picture or coordinating with your dev team, the right dashboard changes everything. It's about clarity, not clutter.
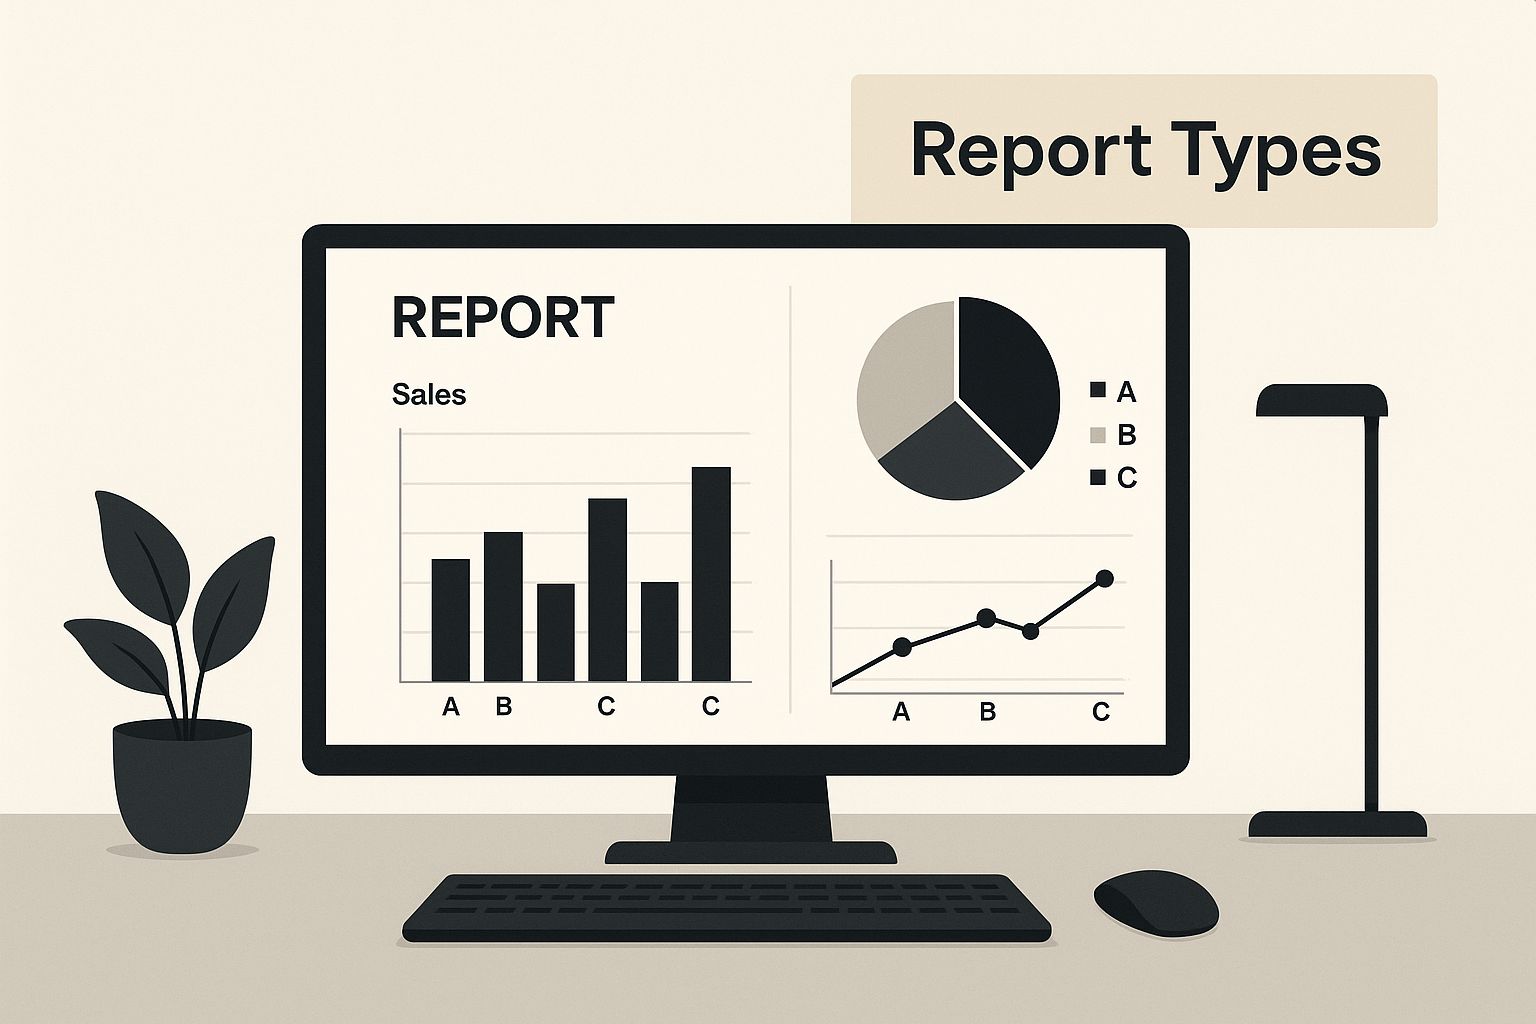
This infographic shows the visual impact you can achieve with a well-built Jira dashboard. Combining different chart types gives you a complete snapshot of your project—from individual tasks to overall team velocity.
I once worked with a team drowning in email chains and status update requests. Stakeholders were frustrated, and the team was spending more time reporting than building. A custom Jira dashboard brought everyone onto the same page (literally!). Suddenly, they had real-time project visibility, saving time and boosting stakeholder confidence. Reporting became a strategic asset, not a chore. Jira gives you so much control—you can create reports and dashboards that actually work for you. Check out these Jira Dashboard Examples for some inspiration. For example, tracking completed issues by project and resolution date using two-dimensional gadgets is a game-changer. It helps you visualize completion rates and spot bottlenecks instantly. Need help with yearly summaries? This resource is gold: Yearly Summary Report.
Tailoring Dashboards to Your Audience
A dashboard designed for an executive won't work for a dev team. Think about your audience. What keeps them up at night? What information helps them make decisions? An executive might care about overall project health and ROI, while a developer needs task assignments and bug reports. It's all about context.
Key Metrics to Consider
Picking the right metrics is key. Don't just throw everything onto the dashboard. Focus on the data that truly matters. Here are a few examples:
- Team Velocity: How fast is your team completing tasks?
- Sprint Burndown: Are you on track to meet sprint goals?
- Issue Resolution Time: How long does it take to fix bugs?
- Code Churn: How much code is being rewritten?
By honing in on these essential metrics, your dashboards will provide valuable insights and drive smarter decisions. Remember, quality over quantity. Too much information is just as bad as no information.
To help illustrate the importance of tailoring your Jira dashboards, let’s look at some key gadgets for different roles:
The following table outlines some essential Jira dashboard gadgets categorized by team role, highlighting their primary uses, key metrics, and best practices.
Essential Jira Dashboard Gadgets by Team Role
| Team Role | Primary Gadgets | Key Metrics | Best Practices |
|---|---|---|---|
| Executive | Portfolio for Jira, Created vs. Resolved Issues Report, Average Age Report | Overall project health, ROI, Budget vs. Actuals, Resource Allocation | Focus on high-level metrics, visualize progress towards key objectives, keep it concise and visually appealing |
| Project Manager | Sprint Burndown Chart, Version Report, Velocity Chart, Control Chart | Sprint progress, Release forecasts, Team performance, Scope creep | Track sprint health daily, monitor velocity trends, use control charts to identify process variations |
| Development Team | Issue Statistics, Assigned to Me, Recently Updated, Two-Dimensional Filter Statistics | Task assignments, Bug reports, Code churn, Work in progress | Filter for individual assignments, track progress on assigned tasks, visualize code quality metrics |
| QA Team | Test Execution Chart, Bug Report, Test Summary | Test coverage, Defect rate, Test cycle time | Track test execution progress, monitor bug trends, visualize test effectiveness |
This table provides a starting point. Feel free to adjust and customize based on your specific needs. The goal is to create dashboards that empower each team member to make informed decisions and contribute to project success.
Advanced Techniques That Make Stakeholders Take Notice
Ready to ditch those basic pie charts in Jira and create reports that actually impress? This is where things get interesting. We're going to dive into some powerful analysis techniques that can reveal hidden patterns in your project data. Forget generic filters; we're talking laser-focused JQL queries that unlock real, actionable insights.
Mastering the Art of JQL
JQL, or Jira Query Language, is like having a secret weapon for precise reporting. Think of it as a super-specific search engine, just for your Jira projects. Instead of those broad, sometimes unhelpful, filters, you can craft queries to pinpoint exactly the data you need.
For example, let's say you want to see every unresolved bug assigned to your team in the last two weeks. A simple JQL query can pull that up in seconds. This granular control is essential for spotting trends and potential problems before they become major headaches. It's like having a magnifying glass for your project, allowing you to zoom in on the critical details.
Filtering for Actionable Insights
Even with basic filters, a little strategy goes a long way. Combining filters based on issue type, status, priority, and assignee can uncover some seriously valuable information.
Let me give you an example from my own experience. I was working on a project where we needed to quickly understand the current workload for our QA team. By filtering for “high priority” bugs assigned to “QA” and with a status of “in progress,” we got a crystal-clear snapshot of their current focus and any potential bottlenecks. This type of focused reporting empowers stakeholders to make quick, informed decisions.
Combining Data Sources for a Holistic View
Advanced reporting often means pulling data from multiple sources. Connecting Jira to other platforms, like Confluence, opens up a whole new world of possibilities.
Imagine combining sprint data from Jira with customer feedback from Confluence. Suddenly, you have a 360-degree view of how the technical work directly impacts customer satisfaction. Jira’s robust reporting features are crucial for managing these kinds of complex projects. Teams can even generate reports spanning several years (like 2018 to 2025) if the historical data exists in their Jira instance. This long-term perspective helps analyze trends and evaluate project management effectiveness over time. Want to learn more about generating reports in Jira? Check out this helpful resource: How can I generate a report?.
Automating Reports to Save Time and Effort
Manually generating reports can be a real time-suck. Automating this process frees you up to focus on the important stuff: getting work done. Jira provides several automation options, including scheduled reports and email notifications.
Try setting up a weekly report that automatically lands in your stakeholders’ inboxes. You'll be amazed at how many status update meetings suddenly become unnecessary.
By mastering these advanced reporting techniques, you can transform your Jira data from a static collection of information into a dynamic tool that drives real decision-making. In the next section, we’ll explore how adding customer context can supercharge your reporting and help you directly connect development work to business outcomes.
Connecting Customer Context with Development Work
Here's the deal: so many teams are missing a huge opportunity by keeping their customer data and development work siloed. Connecting these two creates some seriously powerful insights that can completely change how you work. Think about seeing the real impact of your development efforts on customer satisfaction. That's the potential of integrating HubSpot with your Jira reporting.
Bringing customer context right into your Jira dashboards gives you a big-picture view of how technical work affects your business. Imagine having all the customer info you need right in your Jira issues. No more tab-hopping! See customer history, open tickets, even sales team communication, all right there.
Syncing Customer Feedback with Development Priorities
One of the best things about this integration is automatically syncing customer-reported issues with your development priorities. Let's say a customer reports a bug through HubSpot. With the right integration, this automatically creates a Jira issue, complete with customer details. No manual entry, no missed issues.
Tracking customer satisfaction along with your sprint metrics provides another layer of insight. You'll start to see links between specific features, bug fixes, and changes in customer happiness. This data-driven approach helps justify how you spend your time and prioritize based on real customer impact.
Generating Reports That Demonstrate Business Value
Stakeholders often care more about results than technical details. By generating reports in Jira that show the direct link between development and customer success, you're speaking their language. These reports can show how fast customer issues are resolved, the impact of new features on satisfaction, and the overall ROI of your team's work.
For example, a report might show that a new feature led to a 15% increase in customer retention. This kind of data is incredibly powerful when you're requesting budget or showing your team's value. HubSpot for Jira lets you create these insightful reports by bringing that customer data into your development workflow. Everyone, from developers to executives, can understand the customer impact.
Real-World Example: Bridging the Gap
Imagine a SaaS company struggling to prioritize bug fixes. They have tons of Jira issues but can't figure out which ones matter most to customers. By integrating HubSpot with Jira, they can now see which bugs are affecting their highest-paying customers or leading to the most support tickets. This helps them focus on the problems that affect their bottom line.
This integrated approach enables teams to:
- Justify resources: Demonstrate to stakeholders the direct impact of development work on customer outcomes.
- Prioritize development: Focus on features and fixes that truly matter to customers.
- Communicate impact: Create reports that showcase the business value of technical efforts.
By connecting customer feedback and development work, you'll create a more customer-focused process. The results? Happier customers, better products, and better business outcomes. In the next section, we’ll look at a real-world example of a team that transformed their reporting using this approach.
Real Success: From Reporting Chaos to Clear Insights

Let me tell you about a product team I worked with recently. They were swamped with reporting requests. Seriously, drowning is a good word. Each week, hours were lost manually pulling together updates for stakeholders. It was a mess. They were always playing catch-up, the data was stale, and stakeholders were starting to lose confidence. Any of this sound familiar?
Their main issue was the disconnect between customer feedback in HubSpot and development progress in Jira. Generating reports in Jira meant manually pulling data from different places and Frankenstein-ing it together in spreadsheets. Slow, inefficient, and error-prone. Stakeholders couldn't see the relationship between what customers needed and what the team was building.
The answer? HubSpot for Jira. This integration was the bridge they needed, bringing customer context directly into Jira dashboards. Suddenly, a single source of truth. They could now see exactly which Jira issues were connected to specific HubSpot contacts, companies, and deals. Game changer.
Turning the Tide with HubSpot for Jira
The team took a smart approach, starting small with a few essential reports. They set up automated reports tracking customer-reported bugs and feature requests, prioritized by HubSpot deal size. Boom! Instant clarity on which issues had the biggest impact on the bottom line.
Then, they customized their Jira dashboards to include HubSpot data, like customer satisfaction scores and support ticket volume. This gave stakeholders a real-time view into how development work was affecting the customer experience. No more static spreadsheets. Instead, they had dynamic, interactive dashboards that told a story.
Measuring the Impact
The results? Seriously impressive. The team went from burning 15 hours a week on manual reporting down to just 2. Stakeholder meetings became shorter, more focused, and actually productive. And, most importantly, the team could get back to building great products, knowing they were working on the right things for the right reasons.
They also saw a 20% decrease in customer-reported bugs and a 10% increase in customer satisfaction. Real, tangible improvements that validated the integration and reinforced how crucial it is to connect customer context with development work. It's not just about reports in Jira. It's about meaningful reports.
This team's experience really shows how powerful connecting HubSpot with Jira can be. Sure, saving time is huge (and they saved a lot). But it's more than that. It's about building a customer-centric development process that delivers real business results. Up next, we'll share some practical tips to make your Jira reports even better.
Practical Tips That Separate Good Reports from Great Ones
Generating reports in Jira is one thing, but crafting reports that actually get read and acted upon is a whole different ball game. In my experience, it's often the small details that separate a genuinely useful report from one that just gathers digital dust. Here’s what I’ve learned working with teams who’ve truly mastered the art of Jira reporting.
Designing for Impact
Think about the last report you actually enjoyed reading. What made it so digestible? I bet it wasn't just the raw data, but how that information was presented. Visual hierarchy is crucial. Use clear headings, bullet points, and plenty of white space to guide the reader’s eye through the key takeaways. Don't shy away from visuals either. A strategically placed chart or graph can communicate complex data far more effectively than a wall of text.
Sometimes I see reports that are just data dumps, and honestly, they’re painful to wade through. A little formatting goes a long way!
Timing Is Everything
Just as important as what you report is when you report it. A daily report might be overkill for some stakeholders, while a monthly report might not be frequent enough for others. Consider the cadence that makes sense for each audience. Executive summaries? A monthly or quarterly report might suffice. For dev teams working in sprints? Daily or weekly updates are probably more useful.
Finding the right balance is key to keeping people engaged without overwhelming them with information.
Customization for Different Audiences
One-size-fits-all reporting rarely hits the mark. A CEO cares about different metrics than a project manager. Tailor your reports to the specific needs and interests of each stakeholder group. For executives, focus on high-level metrics like ROI and overall project health. For development teams, dive into the nitty-gritty details of sprint progress, bug fixes, and velocity.
I’ve found this targeted approach makes sure everyone gets the information they need without getting bogged down in irrelevant details.
Keeping Reports Fresh and Relevant
Just like your projects evolve, so should your reports. Regularly review your reports and dashboards – I aim for a quarterly review – to ensure they're still providing value. Are there new metrics you should be tracking? Are there old metrics that have become obsolete? Are your dashboards cluttered with unnecessary gadgets? A little spring cleaning can make a huge difference in keeping your reporting effective. You might be interested in: Jira Custom Reports.
It's easy for reports to become stale, so regular maintenance is crucial.
Building Sustainable Reporting Processes
The best reporting systems are the ones that seamlessly integrate into your team’s workflow. Train your team members on how to use the reporting tools effectively. Document your reporting processes clearly, and make sure everyone understands their role in maintaining accurate data. This creates a sustainable system that can scale with your team and adapt to changing project needs. This means focusing on training and documentation, not just setting up the technical infrastructure.
I've seen firsthand how empowering teams with the right knowledge and processes leads to better reporting and, ultimately, better project outcomes.
To help you build a truly effective reporting process in Jira, I've put together a handy checklist:
Before the table, add an introductory sentence like: "Use this checklist to ensure you're covering all the bases for effective Jira reporting:"
| Category | Best Practice | Common Mistake | Impact |
|---|---|---|---|
| Design | Use clear headings, bullet points, and white space | Overly dense reports with no visual hierarchy | Difficult to read and understand; key insights get lost |
| Timing | Tailor report frequency to the audience (e.g., monthly for executives, weekly for dev teams) | Sending daily reports to everyone | Information overload; stakeholders tune out |
| Customization | Create separate reports for different stakeholders with relevant metrics | Using the same report for all audiences | Information isn't actionable for everyone; reports become irrelevant |
| Relevance | Regularly review and update reports and dashboards | Using the same reports for months without review | Reports become outdated and lose their value |
| Process | Train team members on reporting tools and document processes | Relying on a single person to manage all reporting | Unsustainable process; bottleneck for information; risk of knowledge loss |
After the table, add a concluding sentence like: "By adhering to these best practices, you can ensure your Jira reports are valuable tools that drive informed decision-making and contribute to project success."
Building a great reporting system in Jira does take time and effort, but the payoff is enormous. By following these practical tips, you can create reports that not only inform but also inspire action, leading to better project outcomes and happier stakeholders. And that’s a win-win for everyone.
Your Roadmap to Reporting Excellence
So, you’ve learned a lot about Jira reporting. Great! But now what? How do you actually use all this newfound knowledge? Let's map out a plan to make it happen and see some real results. Think of this as a journey, not a sprint. We’re building sustainable reporting habits, not just quick fixes.
Quick Wins: This Week's Targets
First things first: what are your team's biggest reporting headaches? Are stakeholders always hounding you for updates? Is your team drowning in spreadsheets? Target the reports that will offer the fastest relief.
For example, if your status update meetings are a soul-crushing time suck, a simple Jira dashboard showing sprint progress and issue resolution time can be a game-changer. Think shorter meetings, better communication, and more time for actual work. This is a win you can snag this week.
Building Momentum: Next Month's Game Plan
Once you've tackled the immediate fires, it's time to think bigger. How can you use more advanced reporting techniques to get deeper insights? Dive into JQL queries, play around with different filters, and think about connecting Jira to other tools like Confluence or HubSpot.
Imagine connecting HubSpot with Jira. Suddenly, customer feedback is directly linked to development work. You can prioritize bug fixes and features based on real customer impact. This kind of mid-term goal can seriously sharpen your team's focus and boost efficiency.
Long-Term Vision: Becoming a Jira Reporting Guru
Over the next few months, aim to truly master the art of generating impactful reports in Jira. Learn to tailor reports for different audiences, automate reporting workflows, and actually measure how these improvements affect team performance and stakeholder happiness.
This could mean setting up automated reports that magically appear in stakeholders' inboxes every week, freeing you from endless manual updates. It also means regularly reviewing and tweaking your reporting systems to keep them relevant as your projects and team evolve.
Measuring Your Success
How do you know if your reporting efforts are paying off? Focus on tangible metrics. Track how much time you're saving on manual reporting. Measure how satisfied your stakeholders are. And see how better reporting impacts project delivery. For example, if your team is squashing bugs 20% faster after implementing a new reporting system, that's a clear indicator of progress.
Avoiding Over-Engineering
A common pitfall is trying to build the ultimate reporting system right out of the gate. Resist the urge! Start simple and build from there. Don't aim for perfection on day one. Focus on your team’s most urgent needs and gradually add complexity as you get more comfortable with Jira. Remember, the best reports are the ones people actually use.
This roadmap is your guide to reporting excellence in Jira. It’s not about becoming an overnight expert, but about consistently improving your team’s processes and delivering real, measurable results. Ready to supercharge your reporting by connecting HubSpot CRM with Jira? Try HubSpot for Jira free today and transform your team’s workflow.
