

In today’s fast-paced IT environment, a high-performing service desk is the backbone of business operations. But how do you measure success and drive continuous improvement? It’s not just about closing tickets; it’s about understanding the ‘why’ behind the numbers. This article moves beyond generic lists to provide a deep dive into eight critical service desk KPI examples. We will break down the strategic importance of each metric, providing detailed analysis, calculation methods, industry benchmarks for 2025, and actionable tactics you can implement immediately.
To truly go beyond basic metrics and strategically shape your service desk’s success, consider a comprehensive list of what to track, such as these 7 essential KPIs for customer service. Whether you’re aiming to boost customer satisfaction, optimize resource allocation, or demonstrate tangible value to stakeholders, these KPIs will provide the framework you need. They will help transform your service desk from a cost center into a strategic business asset.
We will also touch upon how integrating tools like HubSpot with Jira, facilitated by apps from resolution Reichert Network Solutions GmbH, can provide the unified data needed for accurate KPI tracking, especially when aligning support issues with customer deal stages and company information.
1. First Call Resolution (FCR) Rate
First Call Resolution (FCR) Rate measures the percentage of customer issues resolved completely during the initial contact, eliminating the need for follow-up calls or escalations. Often hailed as a cornerstone of service desk kpi examples, FCR directly correlates with customer satisfaction and operational efficiency. A high FCR means users get fast, effective support, which boosts their confidence in IT services and reduces the overall ticket volume, freeing up agents to handle more complex issues.
This metric is vital because it provides a clear window into the effectiveness of your front-line support. It helps identify gaps in agent knowledge, process inefficiencies, and areas where self-service resources could be improved.
Strategic Analysis and Implementation
Achieving a high FCR requires a multi-faceted approach. For instance, Salesforce maintains an 80% FCR by employing a tiered support structure. This ensures simple issues are resolved quickly by Level 1 agents, while complex problems are promptly routed to specialists, preventing unresolved tickets from re-entering the queue. Similarly, Dell improved its FCR from 65% to 78% by integrating AI-powered diagnostic tools that guide agents through troubleshooting steps, ensuring consistency and accuracy.
Strategic Insight: A high FCR is not just about closing tickets fast; it’s about empowering agents. Success hinges on providing them with the right tools, knowledge, and authority to solve problems independently.
For a quick reference on how FCR is measured and what to aim for, this summary box highlights the essential data points.
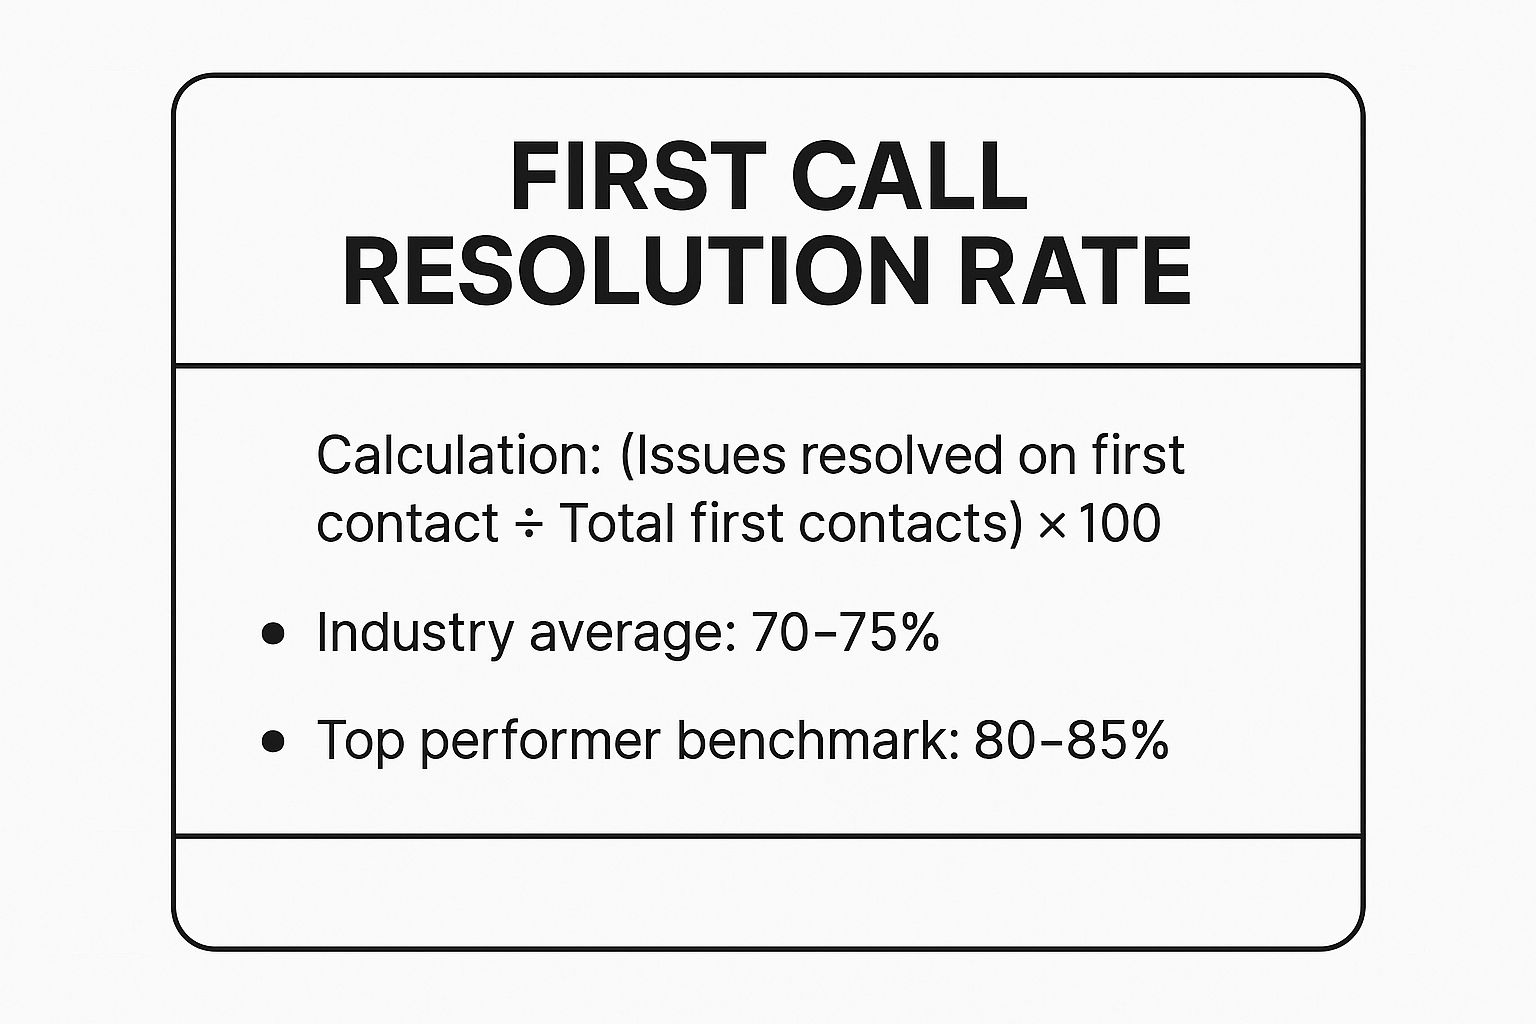
As the data shows, top-performing service desks aim for an FCR above 80%, significantly higher than the industry average, by optimizing their processes and tools.
Actionable Takeaways
To boost your FCR, focus on targeted, practical improvements.
- Develop Robust Knowledge Bases: Create and maintain a comprehensive, easily searchable knowledge management system.
- Implement Proactive Training: Regularly train agents on new products, common issues, and updated resolution processes.
- Empower Agents: Grant agents the necessary permissions and tools to resolve issues without needing constant approvals or escalations.
- Verify Resolution: Use automated surveys or follow-up calls 24-48 hours after closure to confirm the issue is truly resolved from the user’s perspective.
For a deeper dive into improving your FCR and other critical service desk metrics, the video below offers valuable insights.
2. Mean Time to Resolution (MTTR)
Mean Time to Resolution (MTTR) measures the average time elapsed from when a ticket is first created until it is fully resolved and closed. As a fundamental entry among service desk kpi examples, MTTR offers a holistic view of the entire support lifecycle’s efficiency, from initial logging to final solution delivery. A lower MTTR generally indicates a more agile and effective support team, leading to higher user satisfaction and reduced operational friction.
This metric is critical for gauging the overall speed and productivity of your service desk. It helps managers identify bottlenecks in the resolution process, assess agent performance, and set realistic service level agreements (SLAs) with stakeholders.
Strategic Analysis and Implementation
Reducing MTTR is a key objective for high-performing IT organizations. For example, IBM’s Global Technology Services achieved a 40% reduction in MTTR by implementing AI-driven automated incident classification and routing. This system instantly directs tickets to the agent with the most relevant expertise, minimizing delays. Similarly, Atlassian maintains a stringent MTTR of just 2.5 hours for its highest-priority incidents by using tightly integrated monitoring and response tools that provide immediate context and streamline troubleshooting.
Strategic Insight: Reducing MTTR isn’t about rushing agents; it’s about eliminating dead time. The goal is to optimize workflows, automate routine tasks, and ensure tickets move smoothly from one stage to the next without unnecessary holds or handoffs.
As shown by various case studies, companies leveraging platforms like ServiceNow often see a 25-30% improvement in MTTR post-implementation, primarily due to advanced workflow automation capabilities that streamline the entire ticket lifecycle.
Actionable Takeaways
To effectively lower your MTTR, focus on process optimization and intelligent automation.
- Segment MTTR by Priority: Set distinct MTTR targets for different priority levels and issue types to get a more accurate picture of performance.
- Use Median Time to Resolution: Track median time alongside the mean to reduce the impact of extreme outliers and better understand typical performance.
- Automate Ticket Routing: Implement rules to automatically assign tickets to the correct skill groups or agents, cutting down on manual triage time.
- Track Trends Over Time: Focus on the continuous improvement of MTTR trends rather than fixating on absolute numbers, which can be misleading in isolation.
3. Customer Satisfaction Score (CSAT)
Customer Satisfaction (CSAT) Score measures how satisfied users are with the resolution of their specific support interaction. Typically gathered via post-ticket surveys, CSAT offers direct, immediate feedback on service quality from the end-user’s perspective. As one of the most crucial service desk kpi examples, it provides a clear pulse on agent performance and the overall user experience, directly impacting perceptions of the IT department’s value.
This metric is essential because it moves beyond operational efficiency to gauge the human element of support. A high CSAT score indicates that agents are not just closing tickets but are also communicating effectively, showing empathy, and ensuring users feel heard and valued.
Strategic Analysis and Implementation
Achieving a consistently high CSAT requires a deep commitment to service quality. For example, Zappos famously empowers its support agents to go far beyond standard procedures to ensure customer happiness, resulting in a legendary 92% CSAT. They don’t use scripts and have no time limits on calls, focusing entirely on a positive outcome. Similarly, Amazon Web Services (AWS) maintains a 90% CSAT by implementing proactive communication during outages and having clear, rapid escalation paths, ensuring complex issues receive expert attention swiftly.
Strategic Insight: High CSAT isn’t just about solving a problem; it’s about the quality of the interaction. Success depends on creating a customer-centric culture where agents are empowered to deliver an exceptional experience, not just a technical fix.
Monitoring CSAT trends helps pinpoint where service delivery is excelling or failing, offering a direct line of sight into the end-user experience.
Actionable Takeaways
To elevate your CSAT score, focus on improving the quality and consistency of every interaction.
- Keep Surveys Brief: Limit surveys to 1-3 questions to maximize response rates. A simple “How satisfied were you with this interaction?” is often enough.
- Time Surveys Effectively: Send surveys immediately after ticket resolution while the experience is still fresh in the user’s mind.
- Analyze Qualitative Feedback: Include an optional open-ended question like “How could we improve?” to gather specific, actionable insights.
- Follow Up on Negative Feedback: Create a process for managers to contact users who leave poor scores. This demonstrates a commitment to improvement and can often turn a negative experience into a positive one.
4. Service Level Agreement (SLA) Compliance
Service Level Agreement (SLA) Compliance measures the percentage of tickets resolved within the timeframes defined in formal service agreements. This is one of the most fundamental service desk kpi examples, as it directly reflects the service desk’s ability to meet its contractual promises. High SLA compliance builds customer trust, ensures accountability, and demonstrates operational reliability.
This metric is critical for both internal IT departments and managed service providers (MSPs). It provides a clear, objective measure of performance against promised service levels, highlighting potential issues with resource allocation, process efficiency, or ticket prioritization before they escalate into major problems.
Strategic Analysis and Implementation
Achieving and maintaining high SLA compliance requires a proactive and data-driven approach. For example, Accenture sustains over 95% SLA compliance across its global service desk operations by embedding automated escalation rules into its ITSM platform. These rules automatically flag and re-prioritize tickets approaching a breach, ensuring timely intervention. Similarly, HP Enterprise Services reached 98% SLA compliance by leveraging predictive analytics to forecast ticket volumes and complexity, allowing for smarter workload distribution among agents.
Strategic Insight: SLA compliance is not just about avoiding penalties; it’s about proactively managing expectations and resources. True success lies in using SLA data to optimize workflows, not just react to alerts.
Another powerful case is Capgemini, which boosted its SLA compliance from 87% to 94% by implementing skill-based routing. This system ensures tickets are instantly assigned to the agent best equipped to handle them, drastically cutting down on triage and resolution times.
Actionable Takeaways
To improve your SLA compliance rate, focus on systematic monitoring and process automation.
- Set Realistic SLA Targets: Base your SLAs on historical performance data and ticket categorization to ensure they are both challenging and achievable.
- Implement Automated Escalations: Configure your service desk software to automatically notify managers or reassign tickets when an SLA is at risk of being breached.
- Monitor Performance in Real-Time: Use dashboards with live alerts to track SLA performance, allowing teams to address potential issues before they become breaches. You can learn more about how to set up effective service level agreement monitoring on resolution.de.
- Conduct Regular Reviews: Periodically review SLA targets and performance with stakeholders to ensure they remain aligned with evolving business needs and priorities.
5. Ticket Volume and Trend Analysis
Ticket Volume and Trend Analysis tracks the total number of service requests and incidents received over a specific period. It helps identify patterns, seasonal spikes, and emerging issues before they escalate. Among the most fundamental service desk kpi examples, this metric is crucial for effective resource allocation, capacity planning, and proactive problem management. By understanding ticket trends, teams can anticipate future demand and prevent service degradation.
This KPI provides a high-level overview of the service desk’s workload and the overall health of the IT environment. It enables managers to make data-informed decisions about staffing, training, and infrastructure improvements, ensuring the team is always prepared.
Strategic Analysis and Implementation
Proactive trend analysis is a game-changer for operational efficiency. For instance, Microsoft’s support teams meticulously analyze ticket volume trends to forecast support demand related to Windows updates, allowing them to staff up and prepare knowledge articles in advance. Similarly, Google’s internal IT department uses trend analysis to pinpoint systemic bugs or infrastructure weaknesses, resolving them at the root cause before they affect a larger user base.
Strategic Insight: Ticket volume is more than a workload measure; it’s a predictive tool. By correlating trends with business events, system changes, or seasonal cycles, you can move from a reactive support model to a proactive service management strategy.
One notable success story comes from Facebook’s service desk, which reduced its ticket volume by 35%. They achieved this by using automated tools to identify recurring issues early and then deploying targeted self-service solutions and proactive communication campaigns to address them before users even needed to create a ticket.
Actionable Takeaways
To effectively manage ticket volume and leverage trend data, implement these strategies.
- Standardize Ticket Categorization: Use consistent, well-defined tags and categories to ensure data accuracy for trend analysis.
- Correlate Data: Link ticket volume data with business events like software rollouts, marketing campaigns, or system maintenance to understand cause and effect.
- Develop Self-Service Portals: For frequently occurring, low-complexity issues identified through trend analysis, create detailed knowledge base articles and self-help guides.
- Communicate Proactively: Use your trend data to anticipate high-volume periods. Inform users about known issues or planned changes to reduce unnecessary support requests.
For organizations looking to build a culture around these practices, you can learn more about data-informed decision-making on resolution.de.
6. Agent Utilization Rate
Agent Utilization Rate measures the percentage of time service desk agents spend on productive activities, such as handling tickets and communicating with users, versus idle time or non-productive tasks. As one of the most critical service desk kpi examples for operational leaders, this metric helps optimize workforce management, justify staffing levels, and ensure resources are allocated efficiently. A balanced utilization rate indicates that the team is productive without being overworked, which is key to maintaining both service quality and employee morale.

This metric is vital for understanding team capacity and efficiency. It reveals whether agents are being stretched too thin or if there is room to take on more work, helping managers make informed decisions about scheduling and workload distribution.
Strategic Analysis and Implementation
Achieving optimal agent utilization requires sophisticated workforce management. For instance, Cognizant maintains a 75-80% agent utilization rate by using dynamic, skill-based routing that ensures tickets are always assigned to the most available and qualified agent. Similarly, TCS improved its utilization from 65% to 78% by implementing automated task assignments and real-time monitoring, which reduced manual overhead and minimized agent idle time between tasks.
Strategic Insight: The goal isn’t 100% utilization, which leads to burnout and erodes service quality. The key is to find the sweet spot that maximizes productivity while allocating time for essential non-ticket activities like training and knowledge base contributions.
Infosys takes this further by using AI-powered workload prediction to forecast ticket volumes. This allows them to proactively adjust staffing and maintain optimal utilization levels while preserving a healthy work-life balance for their agents.
Actionable Takeaways
To enhance your Agent Utilization Rate without sacrificing quality, focus on smart, sustainable strategies.
- Set Realistic Targets: Aim for a utilization rate between 70% and 80%. This range is widely considered the industry standard for high performance without causing agent burnout.
- Account for Development Time: Officially schedule and track time for activities like training, coaching, and updating knowledge articles as productive work.
- Balance with Quality Metrics: Always analyze utilization alongside metrics like CSAT and FCR to ensure efficiency gains do not come at the expense of service quality.
- Implement Flexible Scheduling: Use workforce management tools to align agent schedules with peak and low ticket volume periods, optimizing coverage and preventing both idle time and overload.
7. Cost Per Ticket
Cost Per Ticket measures the average expense incurred by the service desk to resolve a single ticket. This financial metric is a critical entry among service desk kpi examples because it provides a clear, quantifiable measure of operational efficiency. It encompasses all relevant expenses, including agent salaries, technology licensing, and overhead costs, offering a comprehensive view of the economic impact of the support function.
This KPI is vital for budgeting, resource allocation, and demonstrating the value of IT support to business leadership. By tracking Cost Per Ticket, managers can identify high-cost issue categories and justify investments in automation, training, or self-service technologies that promise a strong return.
Strategic Analysis and Implementation
Reducing costs without sacrificing quality is the primary goal when optimizing for this metric. For example, IBM successfully reduced its cost per ticket by 30% by strategically implementing a robust self-service portal and automating routine ticket handling processes. This allowed them to deflect simpler, high-volume tickets, freeing up human agents to focus on more complex issues that require their expertise. Similarly, Accenture lowered a client’s cost per ticket from $45 to $32 by integrating AI-powered chatbots to handle initial triage and answer common questions, significantly reducing the labor cost associated with each interaction.
Strategic Insight: The lowest possible Cost Per Ticket is not always the best. True optimization involves balancing cost reduction with maintaining high levels of customer satisfaction and first call resolution.
Achieving this balance requires a strategic approach to both technology and process. By focusing on deflecting simple tickets and empowering agents to resolve complex ones more efficiently, organizations can lower costs while simultaneously improving the user experience.
Actionable Takeaways
To effectively manage and reduce your Cost Per Ticket, focus on strategic, targeted improvements.
- Adopt a Fully Loaded Cost Model: Ensure your calculation is accurate by including all direct and indirect costs, such as salaries, benefits, software licenses, and a portion of facility overhead.
- Segment by Category: Track cost per ticket for different types of issues (e.g., password resets vs. hardware failures) to pinpoint the most expensive areas ripe for optimization.
- Invest in Self-Service: Develop and promote a comprehensive knowledge base and self-service portal to empower users to resolve common issues independently.
- Leverage Automation and AI: Use chatbots and automation tools to handle repetitive, low-value tasks, thereby reducing the manual effort required from your support team.
8. Knowledge Base Usage and Effectiveness
Knowledge Base Usage and Effectiveness measures how frequently a knowledge base is accessed by both agents and customers, and how effective it is in resolving issues without direct human intervention. This crucial metric is a pillar among modern service desk kpi examples because it directly supports self-service initiatives and significantly boosts operational efficiency. A well-utilized knowledge base reduces incoming ticket volume, empowers users to find their own solutions, and frees up agents to concentrate on more complex, high-value tasks.
This KPI is vital as it quantifies the return on investment for your knowledge management efforts. It highlights which articles are successful, identifies content gaps, and reveals opportunities to deflect common tickets, ultimately lowering support costs while improving the user experience.
Strategic Analysis and Implementation
A successful knowledge base is an active, evolving resource, not a static document repository. For instance, Atlassian deflects an estimated 60% of potential tickets by combining comprehensive documentation with active community contributions, creating a dynamic problem-solving ecosystem. Similarly, companies using Zendesk typically report a 25-40% reduction in ticket volume after implementing well-structured and actively managed knowledge bases. These results are achieved by analyzing user search data and ticket trends to proactively create relevant content.
Strategic Insight: The value of a knowledge base isn’t in its existence, but in its adoption. Success depends on treating it like a product: continuously improve it based on user feedback, search analytics, and ticket data to meet evolving user needs.
Microsoft’s knowledge base, for example, receives over 1 million monthly searches with a 70% success rate in providing relevant solutions, demonstrating the power of scale when content is meticulously maintained and optimized for search.
Actionable Takeaways
To enhance your knowledge base’s impact, focus on continuous, data-driven improvements. For those starting out or looking to optimize, learning more about building a knowledge base on resolution.de can provide a foundational roadmap.
- Analyze Ticket Trends: Regularly update and create content based on the most common ticket topics and user feedback to address prevalent issues.
- Implement Search Analytics: Use search data to identify failed searches and content gaps, then prioritize creating articles to fill those needs.
- Create Diverse Content: Develop various content types, including videos, step-by-step guides, and FAQs, to cater to different user learning preferences.
- Incorporate User Feedback: Implement article rating systems (e.g., “Was this article helpful?”) and act promptly on negative feedback to improve article quality and relevance.
Key Service Desk KPI Comparison
| KPI / Metric | 🔄 Implementation Complexity | 💡 Resource Requirements | 📊 Expected Outcomes | 💡 Ideal Use Cases | ⭐ Key Advantages |
|---|---|---|---|---|---|
| First Call Resolution (FCR) Rate | Moderate – requires clear definitions, training, follow-up mechanisms | Knowledge bases, agent training, customer callbacks | Higher customer satisfaction, reduced repeat contacts | Customer support aiming to improve first contact success | Strongly linked to satisfaction, cost reduction, improved productivity |
| Mean Time to Resolution (MTTR) | Moderate – calculation excludes waiting, segmentation needed | Automated ticket routing, monitoring tools | Insight into efficiency, SLA management | Efficiency optimization and capacity planning | Identifies bottlenecks, supports SLA setting and resource planning |
| Customer Satisfaction Score (CSAT) | Low – survey deployment and data collection | Survey tools across channels, analytics | Direct feedback on service quality | Measuring customer experience and feedback loops | Direct insight into customer perception, aids service improvements |
| SLA Compliance | Moderate to High – tracking multiple priorities, escalation workflows | Monitoring software, dashboards | Meeting contractual commitments, operational accountability | Environments with strict service contracts | Clear performance targets, maintains customer trust |
| Ticket Volume and Trend Analysis | Moderate – requires consistent data categorization and analytics | Analytics platforms, consistent data tagging | Capacity planning, identifying recurring issues | Resource planning, identifying emerging problems | Enables proactive management and staffing decisions |
| Agent Utilization Rate | Moderate – tracking productive vs total time, requires time management systems | Workforce management tools | Optimized scheduling, workload balancing | Workforce optimization and performance monitoring | Highlights training needs, supports scheduling and coaching |
| Cost Per Ticket | Moderate – requires comprehensive cost accounting and segmentation | Financial data, cost tracking systems | ROI measurement, budgeting accuracy | Budgeting and cost control in service operations | Identifies cost saving opportunities, supports business cases |
| Knowledge Base Usage and Effectiveness | High – requires content creation, maintenance, analytics | Content management platforms, feedback systems | Reduced ticket volume, improved self-service | Enhancing self-service and agent support | Improves efficiency, reduces workload, promotes consistent solutions |
From Data Points to Strategic Advantage: Activating Your KPIs
The journey through these service desk KPI examples reveals a critical truth: measurement is merely the starting point. The real power isn’t in the numbers themselves, but in the strategic decisions they empower. Moving from passive data collection to active, insight-driven improvement is what separates a functional service desk from a high-performing strategic asset.
We’ve explored metrics ranging from the customer-centric CSAT and First Call Resolution to the operational pillars of MTTR and SLA Compliance. Each KPI offers a unique lens through which to view your performance. However, viewing them in isolation can be misleading and counterproductive.
The Pitfall of the Siloed Metric
A myopic focus on a single metric, like relentlessly driving down Cost Per Ticket, can have unintended consequences. Agents might rush through complex issues to close tickets quickly, leading to poor resolutions, repeat contacts, and a nosedive in your Customer Satisfaction Score. This is a classic example of winning a battle but losing the war.
Strategic Insight: True operational excellence is found in the balance and interplay between your KPIs. The goal is to create a “balanced scorecard” where improving one metric positively influences others, rather than cannibalizing them.
Turning Insights into Actionable Strategy
Activating your KPIs means translating data into a continuous improvement cycle. This involves more than just a monthly review; it requires a cultural shift towards data-informed decision-making.
- Foster a Culture of Continuous Improvement: Use your KPI dashboard as a conversation starter in team meetings. Celebrate wins, but more importantly, collaboratively diagnose dips in performance without assigning blame.
- Empower Agents with Tools and Training: If MTTR is climbing, is it because agents lack the training to handle new types of issues? Or do they lack the right tools? Providing context-rich information, for instance, by integrating customer data from HubSpot directly into Jira tickets, can slash resolution times by eliminating the need to switch between systems.
- Address Systemic Issues Proactively: Use Ticket Volume and Trend Analysis to identify recurring problems. Instead of just getting better at fixing the same issue, dedicate resources to creating a permanent solution, such as a knowledge base article or a software patch, to prevent it from happening again.
To truly activate your KPIs and gain strategic advantage, it’s beneficial to consider broader data utilization principles, such as those discussed regarding the importance of adopting people analytics. These principles help frame your service desk data within a larger organizational context, connecting team performance to business outcomes.
Ultimately, leveraging a balanced set of the service desk KPI examples we’ve covered aligns your team with broader business objectives. It transforms the service desk from a cost center into a value-driven engine of customer retention, operational efficiency, and organizational success.
Ready to bridge the gap between your support and development teams to supercharge your KPIs? See how resolution Reichert Network Solutions GmbH can sync critical customer context from HubSpot directly into your Jira issues. Explore HubSpot for Jira today and empower your teams with the information they need to resolve tickets faster and smarter.
