

When we talk about Customer Service KPIs (Key Performance Indicators), we’re really talking about the vital signs for your entire customer experience. These aren’t just abstract numbers; they’re concrete metrics that tell you exactly how effective and efficient your support team is. Think of them as the pulse, blood pressure, and temperature of your customer relationships, showing you where you’re healthy and where you might need to make a change.
These indicators are what allow you to stop guessing and start making smart, data-driven decisions that genuinely improve customer satisfaction and sharpen your operations.
Why Customer Service KPIs Are Your Business’s Dashboard
Ever tried to fly a plane without an instrument panel? You’d have no idea about your altitude, your speed, or even which direction you were headed. Running a customer support team without clear customer service KPIs is the same thing—you’re flying completely blind.
Without these vital signs, there’s no objective way to know if your team is meeting customer expectations. Are issues being resolved quickly? Are customers happy enough to stick around for the long haul? You’d miss the early warning signs of dropping satisfaction or hidden bottlenecks that could eventually send customers running to your competitors. These metrics are the gauges on your business dashboard, giving you real-time feedback on your team’s performance and health.
Organizing Your Metrics For Clarity
To keep from getting lost in a sea of data, it’s a smart move to group your KPIs into a few key categories. This gives you a clear framework for understanding different parts of your service performance. For example, some metrics are all about speed, while others measure the quality of the interaction or the customer’s overall feeling about your brand. An organized approach like this is absolutely essential when creating a robust KPI dashboard that gives you a complete picture.
The infographic below gives a great high-level look at the foundational KPIs that every solid customer service strategy is built on.
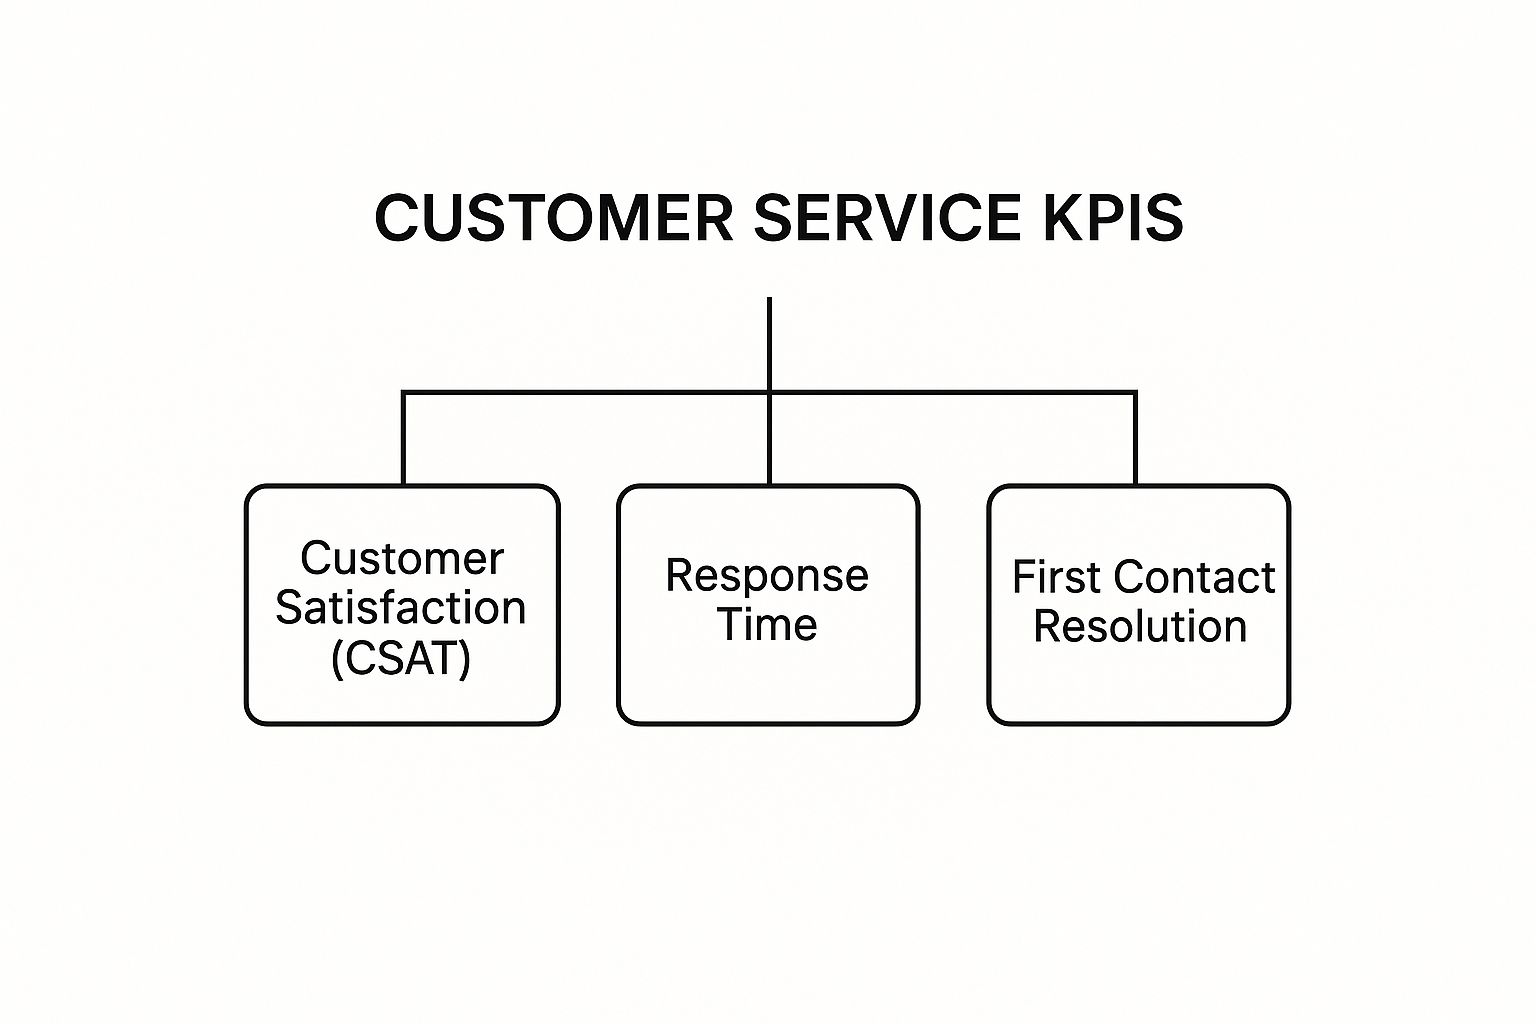
As you can see, metrics for satisfaction, speed, and resolution quality aren’t isolated—they’re all interconnected pillars holding up a successful support operation.
To give you a clearer idea, here’s a quick breakdown of the main categories you’ll want to track.
Core Customer Service KPI Categories
This table summarizes the main types of customer service KPIs and what they help you measure.
| KPI Category | What It Measures | Example KPIs |
|---|---|---|
| Efficiency & Productivity | The speed and resourcefulness of your team. | First Response Time, Average Handle Time |
| Quality & Effectiveness | The success and quality of your support interactions. | Customer Satisfaction (CSAT), First Contact Resolution |
| Business Impact & Loyalty | The long-term effect of service on customer relationships. | Net Promoter Score (NPS), Customer Churn Rate |
Each category gives you a different lens through which to view your performance, creating a well-rounded and actionable perspective.
By monitoring these categories, you graduate from simply putting out fires to strategically managing customer relationships. This shift lets you spot trends before they become problems, train agents on what really matters, and turn your customer service from a cost center into a powerful engine for growth.
Of course, understanding these metrics is just the first step. The real magic happens when you can make them visible and actionable for your whole team. You can learn more about how to set this up by building a customer service metrics dashboard.
Measuring What Matters Most: Customer Satisfaction

Sure, efficiency metrics tell you how fast your team is working, but satisfaction KPIs get to the real heart of the matter: how happy are your customers? These metrics look past operational speed to measure the actual quality and emotional impact of your support. They are the leading indicators of customer loyalty, retention, and how people see your brand.
Think about it this way: efficiency is like measuring how quickly a restaurant can get food to the table. Satisfaction is about how much the diners actually enjoyed the meal. Both are important, but only the latter tells you if they’ll ever come back.
Let’s dig into the three core customer service KPIs for satisfaction.
Customer Satisfaction Score (CSAT)
The Customer Satisfaction Score (CSAT) is your most direct line to a customer’s happiness with a specific interaction. It’s essentially a quick thumbs-up or thumbs-down right after you’ve helped someone.
You get your CSAT score by asking a simple question immediately after closing a support ticket or ending a chat: “How satisfied were you with your support experience?” Customers usually rate their experience on a 1 to 5 scale. This score is a huge deal because it has a direct line to customer loyalty and retention.
The CSAT Formula: (Number of Satisfied Customers [e.g., 4s and 5s] / Total Number of Survey Responses) x 100 = % CSAT Score
A high CSAT score is a clear sign your team isn’t just closing tickets—they’re resolving issues in a way that leaves customers feeling good about the whole experience.
Net Promoter Score (NPS)
While CSAT zooms in on a single interaction, the Net Promoter Score (NPS) zooms out to measure a customer’s overall loyalty to your brand. It asks a much bigger, more powerful question: “On a scale of 0-10, how likely are you to recommend our company to a friend or colleague?”
NPS gives you that bird’s-eye view of your customer relationships. It helps you see if all those individual service experiences are adding up to create brand advocates or, well, the opposite.
Customers are bucketed into three groups based on their answers:
- Promoters (9-10): These are your die-hard fans. They love what you do and will actively tell others about it.
- Passives (7-8): They’re satisfied, but not blown away. These customers are content for now but could easily be tempted by a competitor.
- Detractors (0-6): Unhappy customers. They’re at risk of leaving and might even damage your brand with negative feedback.
The final score is calculated by subtracting the percentage of Detractors from the percentage of Promoters. Simple, yet incredibly insightful.
Customer Effort Score (CES)
How easy was it for a customer to get their problem solved? That’s what the Customer Effort Score (CES) tells you. This KPI is built on a simple but powerful idea: customers stick with companies that are easy to do business with.
After an interaction, you ask something like: “To what extent do you agree with the following statement: The company made it easy for me to handle my issue.” Customers then rate this on a scale, usually from “Strongly Disagree” to “Strongly Agree.”
A high CES means you’re providing a smooth, frictionless journey, which is a massive driver of loyalty. Making things easier for the customer should always be a top priority for any support team, and these 8 crucial service desk KPI examples for 2025 really hammer home just how vital this metric has become.
Boosting Your Team’s Operational Performance

While satisfaction scores tell you how customers feel about you, operational customer service KPIs show you how well your team is actually working. Let’s be honest, a happy customer often starts with a support team that’s running like a well-oiled machine. This is where we shift our focus from the emotional side of things to the engine room of your service operation.
Think of your support team like a pit crew in a high-stakes race. Winning isn’t just about the driver’s talent. It’s about the crew’s speed, precision, and ability to nail the fix on the first try. In this world, speed is your First Response Time, and that first-try effectiveness is your First Contact Resolution. You absolutely need both to take the checkered flag.
First Response Time (FRT)
First Response Time (FRT) is simply the average time a customer has to wait before an agent sends that initial reply. It’s the very first impression you make, and it speaks volumes about your team’s attentiveness. A low FRT basically tells your customers, “We see you, and we’re on it.”
Calculating it is as simple as it sounds:
FRT Formula: Total Response Time for all Tickets in a Period / Total Number of Tickets in that Period = Average First Response Time
This isn’t just about being fast for the sake of speed. A quick response immediately sets a positive tone for the entire conversation and helps manage customer expectations right from the get-go.
Average Handle Time (AHT)
Once your agent has responded, Average Handle Time (AHT) tracks how long it takes, on average, to resolve an issue completely. This clock starts ticking the moment the interaction begins and doesn’t stop until all the follow-up work is done. It’s a pure measure of efficiency.
AHT is a fantastic metric for spotting where things might be going sideways. It can highlight agents who need a bit more training or point out clunky processes that are just creating friction for everyone. When balanced with quality, a lower AHT means your team can handle more inquiries and boost overall productivity.
For more a comprehensive look at boosting business operations, check out these great insights on improving operational efficiency.
First Contact Resolution (FCR)
Now for what might be the most powerful operational KPI of them all: First Contact Resolution (FCR). This metric tracks the percentage of customer issues that are completely solved during the very first interaction. No follow-ups, no transfers, no “let me call you back.”
It’s the ultimate test of both efficiency and effectiveness.
A high FCR is a massive win-win. Customers are thrilled because their problem just vanishes without any extra effort on their part. Meanwhile, your company saves a ton of time and resources by cutting out all those extra, unnecessary interactions. The impact is real and measurable; research shows that just a 1% increase in FCR can slash operational costs by 1%.
FCR is the gold standard because it proves your team isn’t just fast—it’s effective. It shows you have the right people, armed with the right knowledge and the right tools, empowered to solve problems on the spot.
How Technology Is Redefining KPI Measurement
Not so long ago, measuring customer service KPIs felt like a guessing game. It was a manual grind of spot-checking tickets and waiting on survey results that were already out of date by the time you got them.
Today, technology—and AI in particular—has completely flipped the script. These aren’t just passive dashboards for tracking numbers anymore. Modern tools are active players in the support experience, giving managers a real-time, granular view of performance that was once pure fantasy. They don’t just measure metrics; they actively help you improve them.
Automated Support and Customer Effort
One of the biggest game-changers is how automation affects the Customer Effort Score (CES). We all know the feeling of being stuck in a support queue. AI-powered chatbots and callbots eliminate that pain by offering instant, 24/7 help for common problems.
This simple shift has had a massive impact on how teams think about their KPIs. The easier you make it for customers to get help, the more loyal they become. The Customer Effort Score is a fantastic predictor of that loyalty, and when automation makes support feel effortless, CES naturally goes up. You can dig deeper into how these top KPIs for customer service are being reshaped by new tech.
But the benefits don’t stop there. By letting bots handle the routine, repetitive questions, your human agents are freed up to tackle the complex, high-stakes issues where they can really shine. This smart division of labor not only boosts your CES but also drives down the Average Handle Time (AHT) for your human team.
AI-Powered Quality and Sentiment Analysis
Beyond just speed, AI is giving us an incredible new lens into the quality of customer interactions. Imagine trying to manually gauge the mood across thousands of conversations. It’s impossible. You’d have to rely on a tiny, unrepresentative sample of tickets and hope for the best.
Technology now gives us the ability to analyze 100% of interactions for sentiment, tone, and key phrases. AI tools can detect customer frustration or satisfaction in real-time, even if a formal CSAT survey is never completed.
This adds a rich, authentic layer of data to your quality metrics. A manager can get an alert the moment a customer shows signs of frustration, allowing for immediate intervention before the problem gets worse. Quality management is no longer a reactive review process; it’s a proactive strategy.
The advantages here are huge for everyone involved:
- For Agents: They get specific, data-driven coaching. Instead of vague feedback, they learn precisely where to improve, whether it’s their tone or their product knowledge.
- For Customers: They get better service. Issues are spotted and resolved faster, and the whole experience feels more attentive and effective.
This is how technology connects the dots between individual conversations and high-level customer service kpis. It gives teams the power to not just see how they’re doing, but to actively make things better, one interaction at a time.
Putting Your KPIs Into Action With HubSpot and Jira

This screenshot gives you a glimpse into what a truly connected workflow looks like. Instead of forcing developers to jump between tools, it embeds critical HubSpot data—like contact details and ticket info—right inside a Jira issue. This gives your dev team immediate, real-world context for every task.
By connecting these two powerhouse platforms, you’re creating a seamless data pipeline. It’s what turns abstract customer feedback into concrete, actionable development tasks.
Understanding your customer service KPIs is one thing. Actually using them to drive real change is a whole different ballgame. The most powerful metrics are the ones that break down the walls between your teams, connecting support, sales, and product development. This is where integrating your essential software becomes a true game-changer.
When you link your CRM (like HubSpot) with your project management tool (like Jira), you create a closed-loop system for customer feedback. It ensures that valuable insights from support tickets don’t just gather dust in a queue—they become the spark for genuine product improvements. This direct line from a customer’s problem to a developer’s to-do list is how you build a legitimately customer-centric company.
From Customer Ticket to Developer Task
Think about a classic scenario: a customer hits a bug in your software and sends a support ticket through HubSpot. In a disconnected world, that ticket might get a “resolved” stamp, but the root issue? It could linger for weeks, frustrating more and more users along the way.
With a HubSpot and Jira integration, that whole workflow gets a major upgrade. The support agent can link the HubSpot ticket directly to a new or existing Jira issue. This isn’t just about passing along a message; it’s about transferring all the critical context in one click.
This unified workflow means developers don’t have to switch between tools or go on a wild goose chase for information. They see the customer’s history, the ticket’s priority, and any relevant company data right inside the Jira issue they’re already working on.
This streamlined process has a direct and measurable impact on your key performance indicators. It closes the gap between the people talking to customers and the engineers who build the product they use.
Tracking the Entire Issue Lifecycle
Once HubSpot and Jira are in sync, you unlock end-to-end visibility into the entire lifecycle of a customer-reported issue. For anyone obsessed with tracking and improving customer service KPIs, this visibility is a goldmine.
Here’s how it transforms your most important metrics:
- Average Resolution Time: The clock on this KPI no longer stops when a support agent closes their ticket. Now, you can measure the true resolution time—from the second the customer reports the bug to the moment the fix is actually deployed. It’s a much more honest, customer-focused way to measure performance.
- First Contact Resolution (FCR): While the integration won’t magically solve a bug on the first contact, it massively improves communication. Support agents can see the real-time status of the linked Jira issue and give customers accurate, meaningful updates. This simple act prevents those frustrating “any update on this?” follow-up emails.
- Customer Satisfaction (CSAT): Solving a customer’s problem is good. Proactively circling back to let them know the bug they reported has been fixed for good? That’s exceptional. The integration can even trigger automated updates, closing the loop with the customer and turning a potential negative experience into a major brand win.
This level of integration is a cornerstone of strong operational health. To make sure you get the most out of it, always follow established data integration best practices to keep your data flowing cleanly and reliably between systems. At the end of the day, you’re not just moving data around; you’re building a more responsive, efficient, and customer-focused organization.
Got Questions About Customer Service KPIs? We Have Answers.
Diving into a sea of data can feel a little overwhelming. I get it. You’re looking at spreadsheets and dashboards, trying to connect abstract numbers to the real-world performance of your team. It’s totally normal to have questions when you first start rolling out customer service KPIs. Getting straight answers is the first step to building a team culture that’s actually driven by data, not just surrounded by it.
One of the biggest hurdles I see managers face is simply knowing where to start. With dozens of potential metrics out there, it’s easy to get lost. The trick is to start small and zero in on what directly impacts your most pressing business goals.
Are you worried about customer loyalty? Start with Net Promoter Score (NPS). Is team efficiency the main headache? Focus on Average Handle Time (AHT). Don’t try to boil the ocean. Just pick one or two KPIs from each key area—like satisfaction, efficiency, and business impact—to create a balanced and manageable dashboard.
What Is a Good KPI Score, Anyway?
This is the million-dollar question, and the honest-to-goodness answer is: it depends. What’s considered a “good” score for a KPI can vary wildly by industry, company size, and even the support channel you’re looking at. A B2B software company just won’t have the same benchmarks as a fast-fashion e-commerce brand.
That said, some general benchmarks can give you a solid starting point:
- Customer Satisfaction (CSAT): This is usually a percentage. Anything over 80% is widely considered good, but world-class teams are often pushing for 90% or higher.
- First Contact Resolution (FCR): The industry average tends to hover around 74%. Top-tier teams, however, consistently break the 80% mark. A higher FCR is almost always a win, signaling both an efficient team and happy customers.
- Net Promoter Score (NPS): This score is a bit different, ranging from -100 to +100. Any score above 0 is good, over 20 is great, over 50 is excellent, and anything north of 80 is truly world-class.
But here’s the real secret: these are just reference points. The most important benchmark is your own past performance. The goal should always be continuous improvement—beating your own scores from last month or last quarter.
How Do I Get My Team on Board with This?
Introducing KPIs can sometimes feel like “big brother” is watching, which can understandably make your team a bit defensive. To get everyone on board, you have to frame KPIs as tools for growth, not sticks to beat people with. Your best friends here are transparency and open communication.
Start by clearly explaining the why behind each metric you track. Show your agents how a better FCR actually reduces their workload by cutting down on frustrating follow-ups. Explain how a rising CSAT score is a direct reflection of their awesome problem-solving skills. When people see that the numbers are there to help them succeed, they become partners in the process.
Make a habit of celebrating wins publicly. Use the data to have constructive coaching conversations, not just stiff performance reviews. When your team sees that KPIs are helping them sharpen their skills and making their jobs easier, you’ll build a culture of shared ownership where everyone is pulling in the same direction.
Turn customer insights into product improvements seamlessly. resolution Reichert Network Solutions GmbH offers a powerful HubSpot for Jira integration that connects your support and development teams. Break down silos, track issues from start to finish, and use real customer data to build better products. Learn how to unify your workflow today.
