
Let’s talk about Operational Performance Indicators, or OPIs. What are they, really? Think of them as the vital signs for your business operations. They’re the specific, measurable numbers that tell you exactly how well your day-to-day activities are performing, from the factory floor to your customer service desk.
This isn’t about those big, lofty strategic goals. OPIs are all about the here and now. They focus on the real-time health of your processes.
What Are Operational Performance Indicators Anyway?
Picture this: you’re the captain of a massive container ship. Your destination—say, Singapore—is your strategic goal. That’s your Key Performance Indicator (KPI).
But to actually get there, you’re not just staring at a map of Singapore. You’re constantly checking your instruments: engine RPMs, fuel consumption, rudder angle, and the weather radar. Those instruments are your OPIs. They give you the immediate feedback you need to make small adjustments and stay on course.
Without those gauges, you’re sailing blind. You’d only know you have an engine problem when you see smoke billowing from the smokestack, by which time it’s a massive issue. By tracking the right operational metrics, you can spot a tiny dip in oil pressure long before it becomes a crisis.
From Abstract Goals to Concrete Actions
This is where OPIs really shine. They bridge the gap between your company’s grand vision and the tangible work your teams do every single day. They give clarity and purpose to daily tasks by showing how they connect to the bigger picture.
Focusing on this kind of process-level data pays off in a few key ways:
- You can pinpoint waste. OPIs like ‘Machine Downtime’ or ‘Average Handle Time’ don’t hide anything. They immediately throw a spotlight on bottlenecks and inefficiencies in your system.
- You empower your teams. When you give teams access to their own performance data, something powerful happens. It builds a sense of ownership and accountability. Seeing the direct impact of their work is a huge motivator. In fact, it’s a core part of improving team engagement metrics.
- You make smarter decisions. Forget relying on gut feelings. With solid OPIs, managers can make data-driven calls on where to allocate resources, how to improve a process, or when to adjust staffing levels.
The real magic of operational performance indicators is that they make the invisible visible. They shine a light on all the small, cumulative actions that ultimately decide whether you hit your strategic goals or miss them completely.
In the end, OPIs create a shared language of performance across your entire company. They make sure everyone, from the newest hire to the CEO, is looking at the same dashboard and pulling in the same direction toward operational excellence.
How OPIs Drive Real Business Growth
Let’s be honest: tracking the right metrics is the difference between just guessing and actually knowing what works. When we move beyond theory, operational performance indicators (OPIs) are what connect your company’s big-picture goals to the concrete, daily actions your teams take. Think of them as a roadmap, giving everyone clarity and purpose to drive toward strategic objectives.
You can see this tangible impact play out in the real world all the time. Picture a busy logistics company. Their ultimate goal is sky-high customer satisfaction. Instead of just crossing their fingers and hoping for good reviews, they zero in on the OPI of ‘On-Time Delivery Rate’. Every single percentage point they manage to increase that metric translates directly to happier clients, more repeat business, and a much stronger reputation in the market.
It’s the same story for a software-as-a-service (SaaS) firm that wants to be legendary for its customer support. They don’t just talk about “good service”; they live and breathe metrics like ‘First Contact Resolution’ and ‘Average Ticket Resolution Time’. By chipping away at these specific OPIs, they slash customer frustration, bring down churn rates, and seriously boost their brand’s value.
Aligning the Organization for Success
When you get your OPI framework right, it does a lot more than just track numbers—it aligns your entire organization. A powerful culture of shared accountability starts to grow when every department can see exactly how their specific work contributes to the overall health of the company. That kind of alignment is absolutely critical for any kind of sustainable growth.
Just look at how these OPIs create connections across different teams:
- Production Output per Hour: This classic manufacturing OPI has a direct line to the sales team’s ability to promise realistic delivery dates. It also feeds right into the finance team’s revenue forecasts.
- Customer Acquisition Cost (CAC): While this is a core metric for marketing, it also gives the product team crucial feedback for pricing strategies and helps the finance department figure out budget allocation.
- Employee Turnover Rate: This is typically HR’s baby, but a high turnover rate sends shockwaves through the whole business, affecting operational consistency, jacking up training costs, and hurting team morale everywhere.
This web of interconnectedness is how OPIs demolish silos. They get everyone on the same page, making decisions that don’t just benefit their own little corner of the company but push the whole organization forward.
From Data Points to Strategic Advantage
At the end of the day, operational performance indicators are all about turning raw data into a real competitive edge. They hand you the insights you need to sharpen your processes, put your resources where they’ll do the most good, and react to market shifts before your competitors do. Consistently hitting your OPI targets isn’t just an efficiency exercise; it’s how you build a resilient, profitable business that’s wired for growth.
An organization that effectively uses OPIs stops reacting to problems and starts engineering success. The data provides a clear path forward, highlighting opportunities for improvement before they become critical issues.
By focusing on these ground-level metrics, you’re laying a foundation of pure operational excellence. This is what allows you to scale up with confidence, knowing that your day-to-day activities are perfectly in sync with your long-term vision. The right indicators make success a repeatable process, not just a lucky break.
The Four Core Categories of OPIs
Not all metrics are created equal, and they certainly don’t all tell you the same story. If you want a complete, honest picture of your business’s health, you need a balanced diet of metrics covering different parts of your operations. Organizing your operational performance indicators into a few key categories helps you build a dashboard that shows what’s really going on across the board.
Think of it this way: if you only track how fast you can build something, you might completely miss that the quality is tanking. Categorizing your OPIs prevents these kinds of blind spots. It forces a well-rounded perspective. Let’s break down the four essential categories you need to be tracking.
Before we dive into the specific categories, it’s helpful to see how they fit together. The following table breaks down the main types of OPIs, their purpose, and some real-world examples. Use it as a starting point for building a balanced performance measurement system in your own organization.
| Category | Purpose | Example Metrics |
|---|---|---|
| Financial Health | Measures the profitability and efficiency of day-to-day activities. | Operating Cost Ratio (OCR), Return on Assets (ROA), Profit Margin |
| Customer Success | Gauges how well your operations meet customer needs and expectations. | First Contact Resolution (FCR), Customer Churn Rate, Net Promoter Score (NPS) |
| Internal Process Efficiency | Identifies bottlenecks, reduces waste, and streamlines workflows. | Cycle Time, Throughput, Defect Rate |
| People and Growth | Tracks employee engagement, productivity, and development. | Employee Turnover Rate, Training Effectiveness, Productivity per Employee |
This table provides a solid framework, ensuring you’re not just looking at one piece of the puzzle but seeing the entire operational landscape.
Financial Health
This category is your foundation. Financial OPIs are all about measuring the efficiency and profitability of your operations, telling you in no uncertain terms whether your daily grind is creating or draining value. They offer a direct line of sight into the dollars-and-cents impact of your processes.
A classic example is the Operating Cost Ratio (OCR), which simply shows how much it costs to run the business compared to the revenue it brings in. Another powerful metric is Return on Assets (ROA), a go-to indicator used globally to see how effectively a company is using its assets to make a profit. ROA is a huge deal in asset-heavy industries like manufacturing but less so for a service-based company, which just goes to show that context is everything.
Customer Success
Customer-facing OPIs get to the heart of how well your operations are actually meeting the needs and wants of your customers. It’s simple: happy customers lead to loyalty, repeat business, and a killer reputation. These metrics are your barometer for the quality and effectiveness of the entire customer journey.
- First Contact Resolution (FCR): This one’s a gem. It measures the percentage of customer issues you solve on the very first try. A high FCR means your support team is sharp and efficient, which customers absolutely love.
- Customer Churn Rate: This metric tracks the percentage of customers who bail on you over a set period. It’s a painfully direct indicator of whether your product and services are actually delivering the value people signed up for.
Internal Process Efficiency
These OPIs turn the magnifying glass inward, focusing on the nuts and bolts of your internal workflows. The name of the game here is to spot bottlenecks, slash waste, and make your processes faster, cheaper, and more reliable. When you optimize your internal machine, the benefits ripple outward, improving both your bottom line and what your customers experience.
This infographic does a great job of boiling down operational indicators into three core themes: efficiency, quality, and throughput.
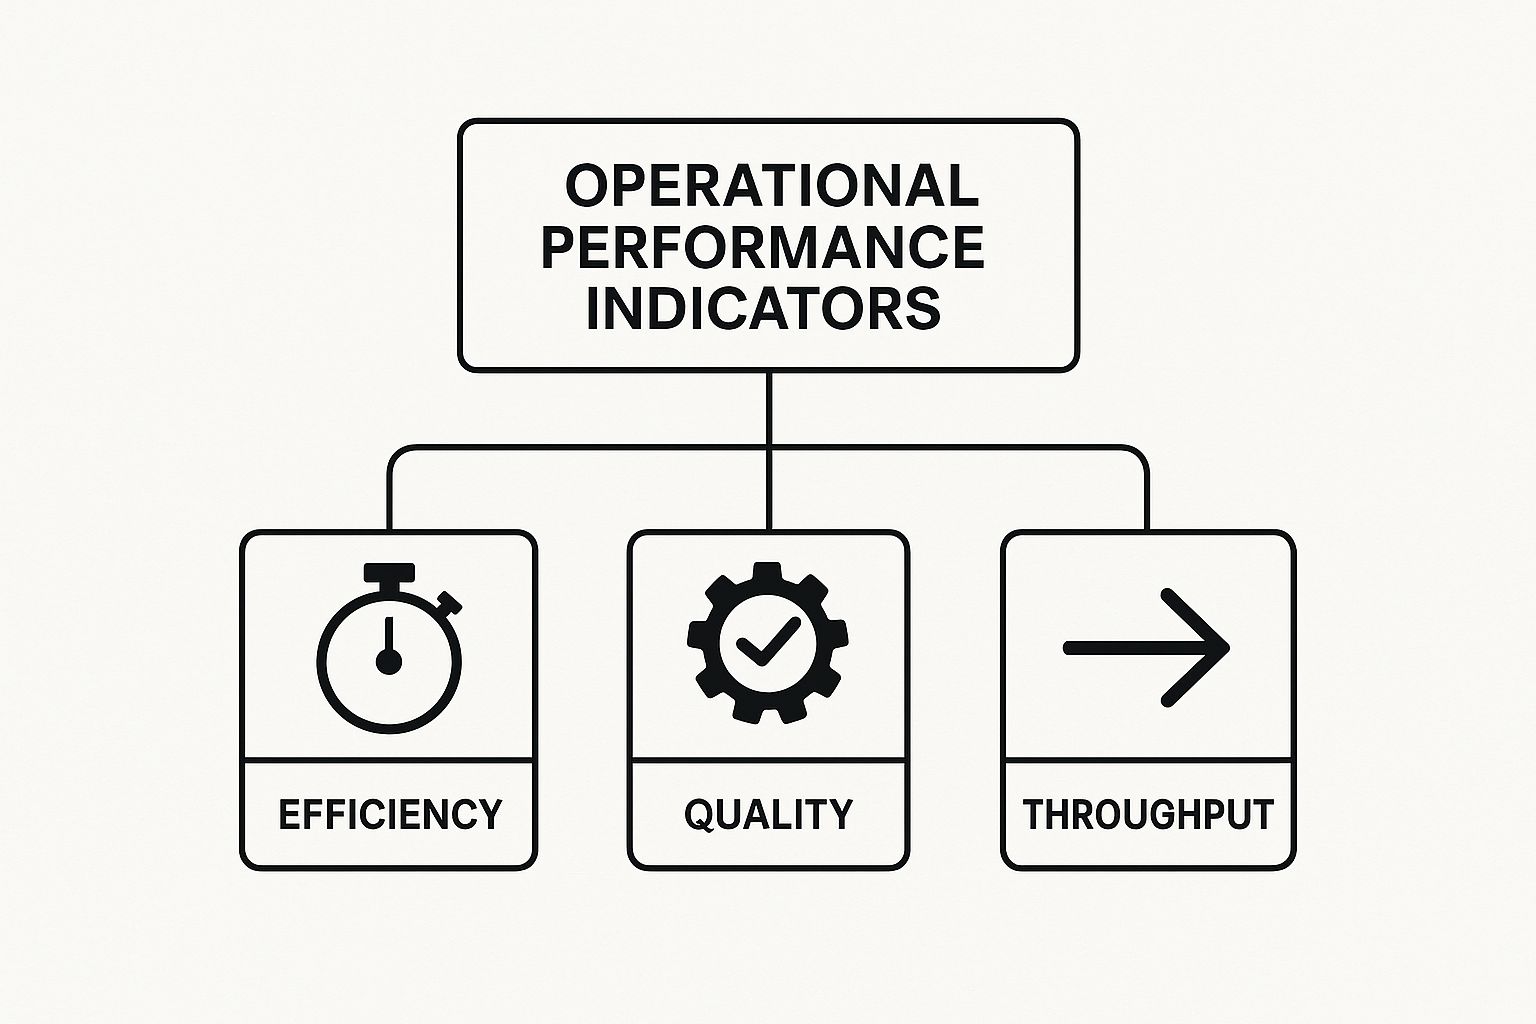
As the visual shows, a balanced approach to your internal metrics ensures you aren’t just working fast—you’re also working smart and consistently. You can see how these OPIs translate into real-world improvements in areas like supply chain metrics and KPIs.
By monitoring internal process metrics, you shift from reacting to problems to proactively refining your operational engine. This consistent fine-tuning is what creates a sustainable competitive advantage.
People and Growth
Let’s be real: your team is your most valuable asset. This final category of OPIs measures everything related to your people—their satisfaction, their productivity, and their professional growth. A healthy, engaged, and skilled workforce is the engine that drives success in all the other areas we’ve talked about.
These metrics help you build a strong company culture and ensure you have the right talent on board to hit your goals. If you want to dig deeper, you might find our guide on continuous improvement metrics a good read, as it really focuses on fostering team growth.
Choosing the Right OPIs for Your Business
Having more data doesn’t automatically lead to more clarity. In fact, it can be the opposite. Tracking the wrong operational performance indicators can be worse than tracking none at all—you end up sending your teams on a wild goose chase, pursuing numbers that don’t move the needle on what truly matters to your business. The secret isn’t more metrics; it’s choosing the few that will have the biggest impact on your strategic goals.
A simple but powerful way to get this right is by using the ‘Goal-Question-Metric’ (GQM) method. It’s a straightforward framework that forces every indicator you track to be directly tied to a meaningful objective. This keeps you from getting lost in a sea of vanity metrics.
Applying the Goal-Question-Metric Framework
The GQM process is brilliant because it makes you start with your strategy, not with a laundry list of available metrics. It breaks down the selection process into three logical steps, connecting high-level ambitions to the data you see on the ground.
Here’s how it works:
- Goal: First, define what you want to achieve in plain language. This needs to be a clear, strategic objective.
- Question: Next, come up with questions that, if answered, would tell you whether you’re on track to hit that goal.
- Metric: Finally, identify the specific data—the OPI—that will give you a straight answer to those questions.
This approach guarantees that every OPI you choose has a clear purpose. You’re not just measuring for the sake of it; you’re gathering actionable intelligence.
A common mistake is to pick metrics first and then try to reverse-engineer a goal for them. GQM flips this on its head, ensuring your OPIs are relevant and actionable from the get-go.
A Practical Example of GQM in Action
Let’s imagine a marketing agency wants to improve client retention. If they used GQM, they would sidestep generic metrics like website traffic and focus on what actually keeps clients happy and coming back for more.
- Goal: Increase client retention by improving our project delivery and service quality.
- Questions:
- Are our clients genuinely satisfied with the work we’re doing?
- Are we hitting our project deadlines consistently?
- How well is our support team resolving client issues when they pop up?
- Metrics (OPIs):
- Client Satisfaction Score (CSAT): This gives a direct answer to whether clients are happy.
- Project On-Time Completion Rate: A hard number that measures our ability to meet deadlines.
- First Contact Resolution: A classic service desk metric that shows how efficiently we solve client problems. For a deeper dive, check out our guide on essential help desk metrics that can help you pick the right ones.
Involve Your Frontline Teams
When you’re deciding on OPIs, don’t make the mistake of doing it in a vacuum. Talk to the people who are in the trenches every single day.
Your frontline teams have an invaluable, ground-level view of what can realistically be measured and what actually impacts performance. When you create these metrics with them, you build a powerful sense of ownership and accountability. They’re far more likely to use the data for genuine improvement instead of seeing it as just another top-down mandate.
Common OPI Mistakes and How to Avoid Them
Bringing operational performance indicators into your workflow can be a total game-changer. But it’s also surprisingly easy to get it wrong. A few common pitfalls can turn a promising, data-driven plan into a frustrating mess.
One of the biggest traps is falling in love with vanity metrics. These are the numbers that look fantastic on a chart but don’t actually move the needle on what matters for your business.

Think “social media followers.” It feels great to watch that number climb, but if it has zero connection to generating leads or making sales, it’s just a distraction. You have to constantly ask yourself: “If this number goes up, does it actually create a better outcome for the business or our customers?” If the answer is a shrug, you’re looking at a vanity metric.
Avoiding Metric Fixation and Misuse
Another huge risk is metric fixation. This is when a team gets so obsessed with hitting a number that they completely lose sight of the real goal behind it.
Imagine a support team laser-focused on lowering their ‘Average Handle Time’. To make the number look good, they start rushing customers off the phone. Sure, the metric improves, but unresolved issues pile up and customer satisfaction plummets. The number looks great, but the business is actually hurting.
The best way to sidestep this is to always pair a quantity metric with a quality metric.
- Pair ‘Sales Calls Made’ with ‘Conversion Rate’. This pushes salespeople to have meaningful conversations, not just dial for dollars.
- Pair ‘Features Shipped’ with ‘User Adoption Rate’. This makes sure your developers are building things that people genuinely use, not just checking boxes.
This kind of balanced approach gives you the full story. It also helps build a much healthier culture where OPIs are seen as helpful guides, not weapons for micromanagement. Using metrics to police your team only erodes trust and encourages people to game the system.
The real point of OPIs is to empower your team with insights, not to catch them messing up. Used the right way, they build accountability and give everyone a shared vision of what success looks like.
Keeping the Big Picture in View
At the end of the day, even the best OPIs need context. Looking at the big picture, operational indicators can even paint a portrait of an entire economy’s health. For example, business birth and death rates are basically large-scale OPIs showing how dynamic a market is.
In the UK, between 2000 and 2016, the number of businesses jumped from 3.47 million to 5.5 million. But here’s the twist: the percentage of those businesses that actually had employees dropped. This points to a rise in solo ventures and a high churn rate, giving critical insight into business sustainability.
This just goes to show that no single number ever tells the whole story. You need a mix of metrics to get a true read on performance, whether you’re managing a small team or a whole company. To build a solid framework that works for you, it’s worth exploring different kinds of performance measures, like the ones we cover in our guide to agile team metrics.
Frequently Asked Questions About OPIs
Even with a solid strategy in hand, questions always pop up when you’re rolling out a new way of measuring things. The world of operational performance indicators (OPIs) can feel a bit murky at first, so let’s clear the air and tackle some of the most common questions we hear from teams.
What Is the Difference Between OPIs and KPIs?
This is a great question, and the distinction is crucial. Think of it like flying in a plane. KPIs (Key Performance Indicators) are your view from 30,000 feet—they measure the ultimate destination, the big-picture outcome. OPIs are your view from the cockpit—they track the specific, daily activities that actually get the plane off the ground and keep it flying smoothly.
For example, a high-level KPI might be to ‘Increase Quarterly Profit by 15%.’ That’s the destination. The OPIs supporting it are the ground-level metrics that directly influence that profit, like ‘Reduce Average Production Cost per Unit’ or ‘Increase Daily Sales per Employee.’ OPIs are the nuts and bolts; KPIs are the strategic targets.
How Often Should We Review Our Operational Metrics?
There’s no magic number here. The right rhythm for reviewing your metrics depends entirely on the speed of the operation you’re measuring. The key is to match your review frequency to the pace of the work itself.
- Real-time or Daily: For high-velocity metrics like ‘Website Uptime’ or ‘Hourly Production Output,’ you need to be watching them constantly or at least every day. These can change in a flash.
- Weekly or Bi-weekly: Process-level metrics often find their sweet spot in a weekly or bi-weekly check-in. Think of things like ‘Customer Onboarding Time’ or ‘Cycle Time.’
- Monthly or Quarterly: Broader financial OPIs, like ‘Operating Margin,’ don’t fluctuate wildly day-to-day. A monthly or quarterly review is usually perfect for these.
How Can a Small Business Start Tracking OPIs on a Budget?
You absolutely do not need a fancy, expensive software suite to get started. The best way to begin is often the simplest: open up a spreadsheet.
First, identify the single most critical process in your business—the one that has the most direct impact on your customer’s happiness or your bottom line.
Then, just pick one or two simple metrics to track for that process. If you run a local coffee shop, it could be ‘Average Customer Wait Time.’ For a freelance designer, maybe it’s ‘On-Time Project Delivery Rate.’ The goal isn’t to build a massive, complicated dashboard overnight. It’s to build the habit of using data-informed decision-making to get better every day. We dive deeper into this mindset in our guide on data-informed decision-making.
How Do You Get Team Buy-In for Tracking OPIs?
This one is all about ownership. The secret is to avoid dictating metrics from on high. Instead, involve your team directly in choosing the OPIs that will measure their work.
Try asking this simple question: “What’s the best way for us to measure success on our team?”
When people help create the yardstick they’ll be measured by, they feel a powerful sense of ownership. It becomes their metric, not just another number they have to report.
Also, it’s critical to frame OPIs as tools for learning and getting better together, not as weapons for pointing fingers. When your team sees that these numbers are there to help them win, their engagement will follow naturally.
Keep your team’s productivity high even when key members are away. With resolution Reichert Network Solutions GmbH, you can automate handovers in Jira so that no task gets dropped during a vacation or sick leave. Ensure your operational performance indicators stay strong by automatically reassigning issues to designated coverers.
Learn how Out of Office Assistant for Jira can protect your workflows
