

In today’s fast-paced business environment, an effective service desk is the backbone of operational success. But how do you measure that effectiveness? The answer goes far beyond simply counting resolved tickets. The key lies in tracking the right service desk metrics: quantifiable measures that reveal the health, efficiency, and impact of your support operations. These metrics transform raw data into actionable insights, enabling you to optimize resource allocation, enhance customer satisfaction, and align IT support with strategic business goals.
Moreover, understanding the dynamics of different support models, such as those found in insights into nearshore contact center operations, further underscores the critical need for well-defined metrics to maintain quality and efficiency across distributed teams. This guide cuts through the noise to focus on the eight most critical service desk metrics you should be tracking today.
We’ll dive deep into what each metric means, how to calculate it, and, crucially, how to monitor it within tools like Jira Service Management. Forget vague theory; this article provides practical steps to help you drive real, measurable improvement in your service delivery. You will learn not just what to track, but how to use that data to make smarter decisions that benefit your agents, your customers, and your bottom line.
1. First Call Resolution (FCR)
First Call Resolution, or FCR, is a foundational service desk metric that measures the percentage of customer issues resolved during the initial interaction. It indicates how effectively your service desk can provide complete, accurate solutions without needing follow-up calls, escalations, or additional contacts from the user. A high FCR is a powerful indicator of both operational efficiency and customer satisfaction, making it one of the most vital service desk metrics to track.

Why FCR Matters
A high FCR directly correlates with lower operational costs, as it reduces the number of repeat contacts and frees up agent time. More importantly, it significantly boosts customer satisfaction and confidence in your support team. When users get their problems solved quickly and on the first try, their perception of your service improves dramatically.
Calculation:
FCR (%) = (Number of issues resolved on first contact / Total number of issues) × 100
How to Improve First Call Resolution
Boosting your FCR requires a strategic, multi-faceted approach. Success stories from industry leaders demonstrate the impact of targeted initiatives. For example, Zappos maintains an impressive 75% FCR by investing heavily in agent training and empowerment, while Microsoft enhanced its FCR from 60% to 80% by implementing AI-powered suggestion tools for its support agents.
Actionable strategies include:
- Empower Your Agents: Equip agents with comprehensive knowledge bases, advanced diagnostic tools, and the authority to resolve issues without unnecessary escalations.
- Implement Intelligent Routing: Use automation in tools like Jira Service Management to route tickets to agents with the specific expertise needed for that issue type.
- Establish Feedback Loops: Regularly analyze tickets that were not resolved on the first contact. Use this data to identify knowledge gaps, process inefficiencies, or recurring complex problems that need better documentation or training.
- Set Realistic Goals: While aiming high is good, set achievable FCR targets. Industry benchmarks typically fall between 70-75%, though this can vary based on the complexity of your services.
2. Mean Time to Resolution (MTTR)
Mean Time to Resolution, or MTTR, is a fundamental metric that calculates the average time from when a ticket is first created until it is fully resolved and closed. This critical service desk metric offers a comprehensive view of your support team’s efficiency and the overall complexity of the issues they handle. A low MTTR indicates that your team can diagnose and solve problems quickly, minimizing disruption for end-users and showcasing a streamlined resolution process.
Why MTTR Matters
Tracking MTTR is essential for understanding your team’s capacity and identifying bottlenecks in your support workflow. Reducing this metric leads to enhanced user productivity, as they spend less time waiting for fixes. It also helps manage service level agreements (SLAs) effectively and provides clear data on whether process improvements, new tools, or additional training are having the desired impact on team performance.
Calculation:
MTTR = (Total time taken to resolve all tickets) / (Total number of resolved tickets)
How to Improve Mean Time to Resolution
Lowering your MTTR hinges on optimizing your entire incident lifecycle. Many top-performing companies have achieved significant reductions through strategic automation and workflow analysis. For instance, Atlassian cut its MTTR from 48 to 12 hours by implementing automated triage and intelligent ticket routing. Similarly, IBM’s internal IT department reduced its MTTR by 50% by leveraging AI for incident classification and routing.
Actionable strategies include:
- Segment MTTR by Priority: Analyze resolution times based on issue priority (e.g., P1: 1-4 hours, P2: 4-8 hours). This helps you focus improvement efforts where they will have the most significant business impact.
- Automate Escalation and Routing: Use Jira Service Management automation to create rules that automatically escalate tickets approaching SLA deadlines or route them to specialized teams, eliminating manual handoffs.
- Use Median for Accuracy: Consider tracking the median time to resolution alongside the mean. The median is less affected by a few unusually long-running tickets and can provide a more accurate picture of typical performance.
- Review Bottlenecks: Regularly conduct workflow reviews to pinpoint stages where tickets stall. Analyzing the “Time in Status” report in Jira can reveal where the biggest delays occur, allowing for targeted process improvements.
3. Customer Satisfaction Score (CSAT)
Customer Satisfaction Score, or CSAT, is a direct measurement of how happy customers are with a specific service desk interaction. It’s typically collected through a post-interaction survey asking users to rate their experience on a scale, most commonly 1-5. This metric provides immediate, actionable feedback on individual agent performance and the overall quality of support, making it one of the most crucial service desk metrics for gauging user sentiment.

Why CSAT Matters
CSAT is a direct line to the customer’s voice, offering a clear view of their perception of your service. High CSAT scores are linked to increased customer loyalty, retention, and a better overall brand reputation. Tracking this metric helps you pinpoint specific areas of friction in your support process and identify high-performing agents who can serve as models for the rest of the team. This focus on customer experience optimization is vital for long-term success.
Calculation:
CSAT (%) = (Number of satisfied customers (ratings of 4 or 5) / Total number of survey responses) × 100
How to Improve Customer Satisfaction Score
Boosting your CSAT score involves a commitment to understanding and acting on customer feedback. For instance, Amazon’s customer service consistently maintains CSAT scores above 90% by obsessively focusing on a frictionless customer journey. Similarly, Salesforce improved its CSAT from 78% to 88% by implementing personalized service approaches that made customers feel valued and understood.
Actionable strategies include:
- Keep Surveys Short and Simple: To maximize response rates, limit surveys to 2-3 essential questions. Send them immediately after a ticket is resolved while the experience is still fresh in the user’s mind.
- Combine Quantitative and Qualitative Data: Use a rating scale for a quick quantitative score, but also include an optional open-ended question like “How could we have improved?” to gather valuable qualitative insights.
- Segment Your CSAT Data: Don’t just look at the overall score. In tools like Jira Service Management, you can analyze CSAT by issue type, request channel, or individual agent to uncover deeper trends and specific improvement opportunities.
- Close the Feedback Loop: When you receive negative feedback, follow up with the customer. Acknowledging their experience and explaining how you’ll address their concerns can turn a negative interaction into a positive one.
4. Ticket Volume and Trends
Ticket Volume and Trends is a fundamental service desk metric that tracks the total number of incoming requests and incidents over specific time periods. It goes beyond a simple count by analyzing patterns, seasonal variations, and the overall growth or decline in service demand. This metric provides a high-level view of your service desk’s workload, helping with resource planning and strategic decision-making.
The following infographic illustrates a typical analysis, showing a six-month volume trend alongside a breakdown of tickets by category.
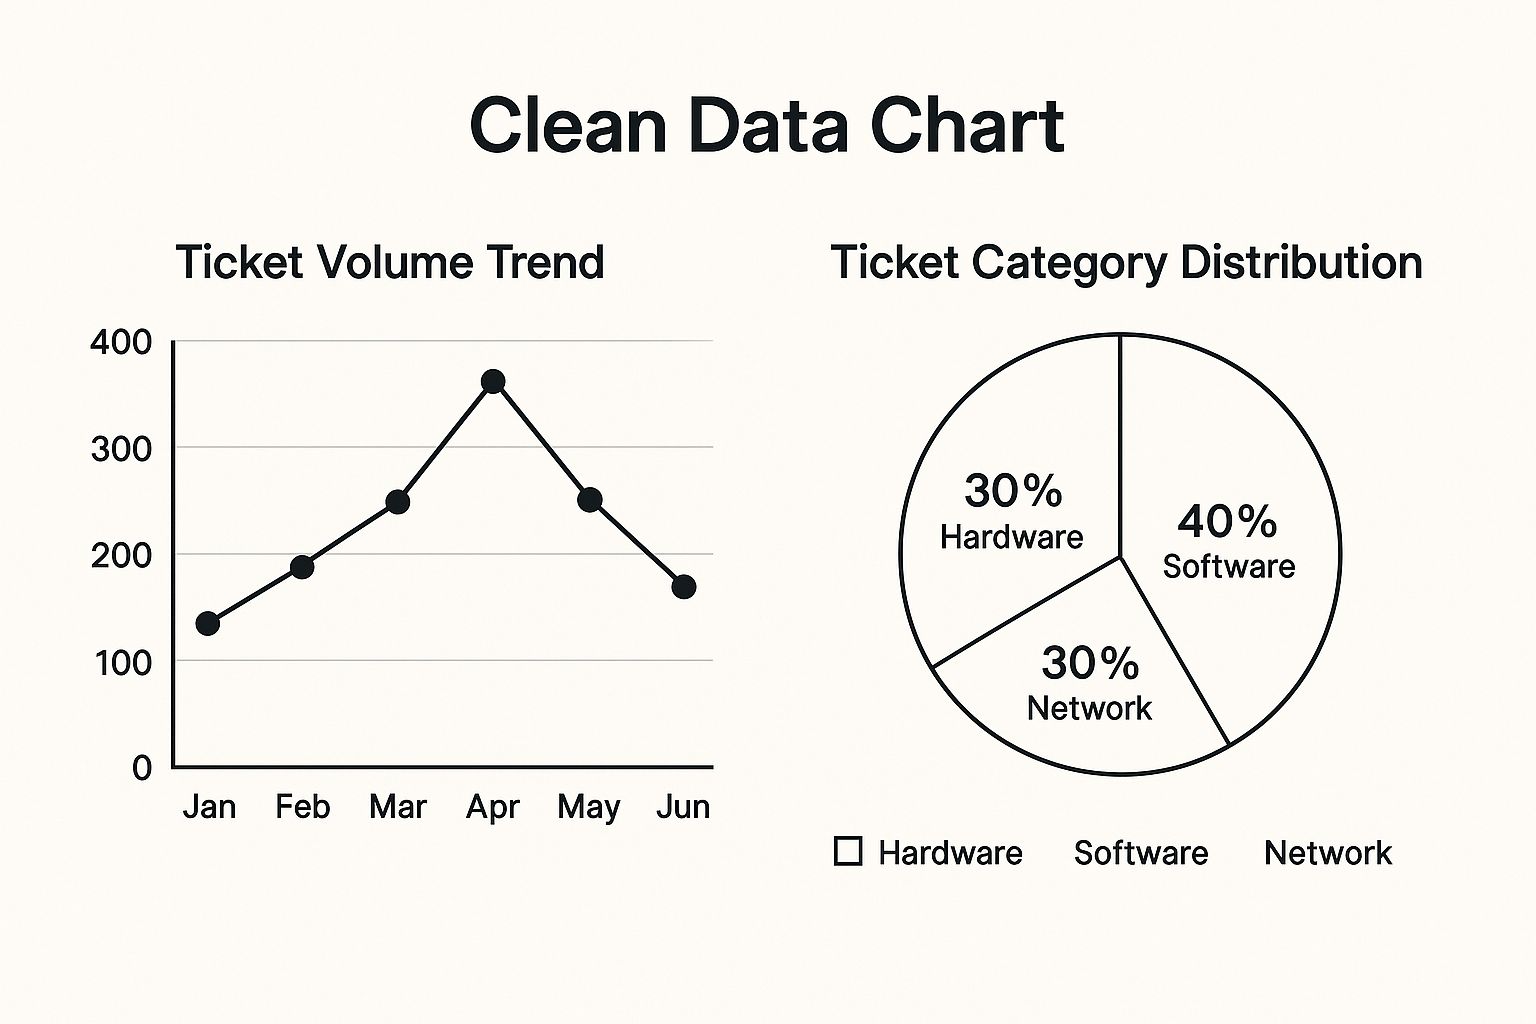
This visualization reveals that software-related issues constitute the largest portion of tickets, while the overall volume shows a steady increase over the past six months, indicating a growing demand for support.
Why Ticket Volume and Trends Matter
Analyzing ticket volume is crucial for proactive resource management and identifying underlying issues. A sudden spike in tickets after a new feature release, for example, can signal a bug or user-training gap. Companies like Spotify use this type of analysis to pinpoint when new app features cause support surges, allowing them to respond quickly. Similarly, Netflix monitors volume to anticipate demand during major content releases, ensuring adequate support staffing.
Calculation:
Ticket Volume is typically a raw count of tickets created within a defined period (e.g., day, week, month). Trend analysis involves comparing these counts over time to calculate the percentage change.
How to Improve Your Use of Ticket Volume Data
Effective analysis of ticket volume transforms it from a simple count into a strategic asset. Microsoft’s internal IT, which processes over 2 million tickets annually, uses volume trends to accurately predict staffing needs and allocate resources efficiently. This proactive approach helps maintain service levels despite fluctuating demand.
Actionable strategies include:
- Implement Consistent Categorization: Establish and enforce strict categorization standards in your service desk tool. This ensures that volume data can be accurately segmented by type, such as hardware, software, or network issues.
- Monitor Alongside Quality Metrics: Never look at volume in isolation. A drop in volume might seem positive, but it could be linked to a drop in customer satisfaction if users are simply giving up on seeking help. Pair volume with metrics like CSAT for a complete picture.
- Use Forecasting for Planning: Analyze historical data in Jira Service Management to forecast future ticket volumes. This allows you to plan for seasonal business cycles, holidays, or major project launches.
- Analyze by Source: Break down ticket volume by its source (e.g., email, portal, phone). If a high volume comes from a specific channel, it could highlight an opportunity for self-service improvements or better automation. Understanding these help desk best practices can further refine this strategy.
5. Agent Utilization Rate
Agent Utilization Rate is a critical productivity metric that measures the percentage of an agent’s logged-in time spent on support-related activities. This includes direct ticket work, customer interactions, and contributing to the knowledge base, as opposed to being idle or engaged in non-productive tasks. It provides a clear view of how effectively your team’s time is being managed, making it one of the most important service desk metrics for optimizing workforce efficiency.
Why Agent Utilization Rate Matters
Tracking utilization helps managers ensure that staffing levels are appropriate for the incoming workload, preventing both under-utilization (wasted resources) and over-utilization (agent burnout). A healthy utilization rate indicates that your team is productive without being overworked, which is essential for maintaining both service quality and employee morale. It helps identify opportunities for better scheduling and resource allocation.
Calculation:
Agent Utilization Rate (%) = (Total time spent on productive activities / Total logged-in time) × 100
How to Improve Agent Utilization Rate
Balancing productivity with well-being is key to optimizing this metric. Industry leaders focus on smart management rather than simply pushing for higher numbers. For instance, Dell’s technical support aims for a 75-80% utilization rate by integrating quality checks, while Accenture maintains an 80% rate through intelligent workforce management systems that forecast demand and schedule agents accordingly. Freshworks recommends a 70-75% rate as optimal to ensure quality isn’t sacrificed.
Actionable strategies include:
- Set Realistic Targets: Aiming for 100% utilization is a recipe for burnout. A healthy range is typically 70-80%, which allows for breaks, training, and administrative tasks.
- Define “Productive Time” Broadly: Productive activities aren’t just ticket resolution. Include valuable tasks like updating knowledge base articles, participating in training sessions, and collaborating with other teams. This encourages a holistic approach to support.
- Optimize Scheduling with Data: Use historical ticket data to identify peak and off-peak hours. Schedule agents accordingly to match demand, minimizing idle time and ensuring coverage when it’s needed most. You can learn more about strategic staff capacity planning to master this.
- Balance with Quality Metrics: Never track utilization in a vacuum. Always analyze it alongside Customer Satisfaction (CSAT) and First Call Resolution (FCR) to ensure that increased productivity doesn’t come at the cost of service quality.
6. Service Level Agreement (SLA) Compliance
Service Level Agreement (SLA) Compliance measures the percentage of service requests and incidents that are resolved within the timeframes specified in your SLAs. This critical metric tracks your team’s performance against promised service levels, ensuring you meet contractual obligations and manage customer expectations effectively across different priority levels. High SLA compliance is a direct reflection of your service desk’s reliability and commitment to its users.
Why SLA Compliance Matters
Meeting SLAs is fundamental to building trust and maintaining healthy business relationships, whether with internal departments or external clients. Consistently hitting these targets demonstrates dependability and professionalism, which directly impacts customer satisfaction and retention. Failing to meet SLAs can lead to financial penalties, damaged reputation, and loss of business, making it one of the most important service desk metrics for accountability.
Calculation:
SLA Compliance (%) = (Number of tickets resolved within SLA / Total number of tickets) × 100
How to Improve SLA Compliance
Improving your SLA compliance rate involves a combination of proactive monitoring, process optimization, and realistic goal-setting. For instance, IBM Global Services sustains over 95% SLA compliance by leveraging automated monitoring and intelligent escalation workflows. Similarly, Capgemini maintains 96% compliance across complex client environments by continuously refining its processes based on performance data.
Actionable strategies include:
- Set Realistic SLA Targets: Define achievable SLA goals based on ticket priority, complexity, and your team’s capacity. Use industry benchmarks as a guide, but tailor targets to your specific operational capabilities.
- Implement Automated Alerts: Use features within tools like Jira Service Management to configure automated notifications for tickets approaching an SLA breach. This allows agents and managers to prioritize at-risk tickets before they become overdue.
- Regularly Review and Adjust SLAs: Performance is not static. Schedule periodic reviews of your SLA data and gather customer feedback to ensure your agreements remain relevant, fair, and aligned with evolving business needs.
- Use Data for Process Improvement: Analyze SLA breach data to pinpoint recurring bottlenecks. This could reveal issues like inadequate staffing during peak hours, knowledge gaps, or inefficient workflows that need to be addressed.
7. Cost Per Ticket
Cost Per Ticket is a critical financial metric that calculates the total operational expense required to resolve a single support ticket. This metric provides a clear view of the economic efficiency of your service desk by factoring in all associated expenses, including agent salaries, technology and software licensing, facilities, and other overhead. Understanding your Cost Per Ticket is fundamental for budgeting, resource allocation, and demonstrating the financial value of your support operations.
Why Cost Per Ticket Matters
Tracking Cost Per Ticket helps organizations make informed decisions about technology investments, staffing levels, and process improvements. A high or rising cost can signal inefficiencies, while a low or decreasing cost indicates strong operational health. Evaluating the efficiency of your service desk often involves looking at how various solutions contribute to overall operational costs, such as the potential for cost savings from effective phone answering services. This metric is a powerful tool for justifying investments in automation and self-service initiatives that drive long-term value.
Calculation:
Cost Per Ticket = Total Monthly Service Desk Operating Costs / Total Number of Tickets Resolved in the Month
How to Improve Cost Per Ticket
Lowering your Cost Per Ticket requires a focus on operational efficiency and strategic investment. For example, Microsoft successfully reduced its cost per ticket by 40% through the large-scale implementation of AI-powered automation and comprehensive self-service portals. Similarly, managed service providers like Accenture often achieve a cost per ticket that is 20-30% below industry averages by optimizing processes and leveraging economies of scale. Industry benchmarks from Gartner suggest an average cost between $15-25 for basic support, providing a useful comparison point.
Actionable strategies include:
- Calculate Costs Comprehensively: Ensure your calculation includes all relevant expenses, such as direct and indirect labor, technology (like Jira Service Management licenses), facilities, and departmental overhead for an accurate picture.
- Segment Your Analysis: Don’t rely on a single, blended number. Segment cost per ticket by ticket type, complexity, or channel (e.g., phone, email, portal) to identify specific areas for improvement.
- Invest in “Shift-Left” Strategies: Promote self-service options and improve knowledge base documentation to deflect tickets from the service desk entirely, which is the most effective way to reduce overall costs.
- Justify Automation: Use your cost per ticket data to build a business case for investing in automation tools that handle repetitive, low-value tasks, freeing up agents for more complex issues.
8. Escalation Rate
Escalation Rate measures the percentage of support tickets that cannot be resolved by first-level support and must be passed on to a higher-level support tier, management, or a specialized team. It serves as a critical barometer for the capabilities of your frontline agents and the efficiency of your tiered support structure. A low escalation rate suggests that your Level 1 team is well-equipped and knowledgeable, while a high rate can signal underlying issues in training, tools, or process design, making it a vital service desk metric to monitor.
Why Escalation Rate Matters
Tracking the Escalation Rate helps identify gaps in your support process. It reveals whether first-level agents have the necessary training, access to information, or authority to handle common issues. A high rate can lead to increased operational costs, longer resolution times, and customer frustration as issues are passed between teams. Conversely, a low rate indicates that your support model is efficient, resolving issues at the least expensive and fastest tier.
Calculation:
Escalation Rate (%) = (Number of escalated tickets / Total number of tickets) × 100
How to Reduce Escalation Rate
Lowering your escalation rate requires a focus on empowering your first-level support team. For instance, Cisco’s renowned technical support maintains escalation rates below 15% by investing in extensive, continuous training for its L1 agents. Similarly, Oracle successfully reduced its escalation rates from 25% to just 12% by integrating an AI-powered knowledge base that provides agents with real-time solutions and diagnostic guides.
Actionable strategies include:
- Analyze Escalation Reasons: Dig into why tickets are being escalated. Is it due to a lack of knowledge, insufficient permissions, or a complex recurring problem? Use this data to target training or create new knowledge base articles.
- Implement Robust Knowledge Management: A well-maintained and easily searchable knowledge base in a tool like Jira Service Management gives L1 agents the answers they need, when they need them, preventing unnecessary escalations.
- Track Escalation Trends: Monitor escalation patterns to spot emerging product issues or changes in customer needs. Proactively addressing these trends is a key part of effective incident management. You can learn more about developing a robust strategy in our guide to incident management best practices.
- Set Realistic Targets: While a 0% escalation rate is impossible, setting a realistic goal is crucial. Industry benchmarks vary, but aiming to reduce rates by 20-30%, as seen by many ServiceNow customers after implementation, is an achievable target.
Service Desk Metrics Comparison Matrix
| Metric | Implementation Complexity 🔄 | Resource Requirements ⚡ | Expected Outcomes 📊 | Ideal Use Cases 💡 | Key Advantages ⭐ |
|---|---|---|---|---|---|
| First Call Resolution (FCR) | Medium – requires robust tracking systems; multi-channel measurement challenges | Moderate – training, knowledge base, and routing systems | Higher customer satisfaction, reduced repeat contacts, cost savings | Customer support aiming to resolve issues on the first contact | Improves agent productivity, reduces backlog, boosts loyalty |
| Mean Time to Resolution (MTTR) | Medium – needs time tracking and segmentation by priority | Moderate – automation, incident classification tools | Faster overall resolution, bottleneck identification | Service desks focused on reducing resolution time and SLA compliance | Clear visibility into efficiency, aids staffing and SLAs |
| Customer Satisfaction Score (CSAT) | Low – simple survey deployment and response tracking | Low – survey tools and data analysis | Direct insight into customer perceptions, identification of service gaps | Services emphasizing customer experience measurement | Strong correlation with retention, direct feedback source |
| Ticket Volume and Trends | Medium – requires consistent categorization and trend analysis tools | Moderate – data collection systems and forecasting models | Workload forecasting, recurring issue identification | Capacity planning, staffing optimization, and demand prediction | Enables proactive resource planning and budget justification |
| Agent Utilization Rate | Medium – tracking productive vs idle time, scheduling tools | Moderate – workforce management and monitoring tools | Optimized staffing, balanced workloads, productivity insights | Service desks managing agent productivity and scheduling | Improves resource allocation, identifies training needs |
| SLA Compliance | Medium – requires accurate tracking and monitoring systems | Moderate – alerting tools and performance dashboards | Meets contractual commitments, improves service reliability | Businesses needing strict adherence to service contracts | Provides accountability and drives process improvements |
| Cost Per Ticket | High – needs detailed cost accounting and segmentation | High – financial tracking systems integration | Economic efficiency understanding, cost optimization | Organizations focusing on financial efficiency of service desk | Supports budget planning and ROI justification |
| Escalation Rate | Medium – tracking escalations and reasons, requires knowledge tools | Moderate – training, knowledge management, monitoring | Reduces unnecessary escalations, identifies training needs | Support centers aiming to optimize skill distribution | Improves first-level resolution and lowers costly escalations |
From Metrics to Momentum: Turning Data into Action
Navigating the world of service desk management without the right data is like trying to find your way in the dark. The eight essential service desk metrics we’ve explored, from First Call Resolution (FCR) and Mean Time to Resolution (MTTR) to Customer Satisfaction (CSAT) and SLA Compliance, serve as your guiding lights. They illuminate performance, reveal hidden inefficiencies, and highlight opportunities for profound improvement. Mastering these KPIs is not just about hitting targets; it’s about understanding the story your service desk operations are telling.
The true value, however, isn’t found in the raw numbers themselves. It’s unlocked when you transform this data from passive information into a catalyst for proactive change. Your dashboards in tools like Jira Service Management should be more than digital decorations. They must become central to your team’s operational rhythm and strategic planning.
Building a Cadence for Continuous Improvement
To avoid “analysis paralysis,” establish a structured routine for reviewing your metrics. This ensures that insights are consistently translated into action.
- Weekly Tactical Huddles: Dedicate a short, focused meeting each week to review leading indicators. Discuss ticket volume trends, check agent utilization rates, and monitor any immediate dips in FCR or CSAT. This is the forum for identifying and addressing immediate bottlenecks before they escalate.
- Monthly Strategic Reviews: Use a monthly meeting to zoom out and analyze lagging indicators. Examine trends in MTTR, overall SLA compliance, and Cost Per Ticket. Are your improvement initiatives from the previous month having the desired effect? This is where you connect operational performance to broader business objectives.
Key Takeaway: Don’t just track metrics; institutionalize the process of discussing them. Celebrate the wins to boost morale, and collaboratively diagnose the challenges to foster a culture of shared ownership and problem-solving.
Connecting the Dots for Deeper Insights
The most powerful insights often emerge when you correlate different metrics. A rising Escalation Rate isn’t just a number; it might be directly linked to declining FCR or insufficient agent training. Similarly, a high CSAT score means little if your Cost Per Ticket is unsustainable.
By analyzing these relationships, you move beyond surface-level observations to uncover the root causes of performance issues. Ultimately, the insights gleaned from these service desk metrics are invaluable for driving significant improvements and helping your organization to achieve broader goals like efficiently managing and optimizing business processes. This holistic view empowers you to make smarter, data-driven decisions that enhance service quality, boost team efficiency, and deliver tangible business value. The goal is to create a virtuous cycle where data informs action, and action improves the data, building unstoppable momentum for your service desk.
Ready to enhance your team’s availability and ensure your service desk metrics remain accurate, even during absences? Explore how resolution Reichert Network Solutions GmbH can help you manage out-of-office statuses directly within Jira, preventing bottlenecks and maintaining operational clarity. Learn more about Out of Office Assistant for Jira and start turning data into decisive action today.
