

In today’s competitive environment, inefficiency is a silent killer of productivity and profit. Disjointed workflows, hidden bottlenecks, and poor communication between teams can derail even the most promising projects. The solution isn’t just working harder; it’s working smarter. This is where business process mapping becomes a critical strategic tool. By visually representing how work gets done, you can uncover hidden inefficiencies, clarify roles, and build a blueprint for operational excellence.
For Jira administrators and DevOps managers, this means visualizing CI/CD pipelines to pinpoint delays. For sales and marketing teams using HubSpot, it’s about mapping the customer journey to eliminate friction and improve conversion rates. The core challenge is that a one-size-fits-all approach doesn’t work. The method you use to map a high-level sales funnel is fundamentally different from the one needed to detail a complex software deployment workflow.
This is why mastering a range of business process mapping techniques is essential for any team focused on continuous improvement. Choosing the right visualization method provides the specific lens needed to see and solve the right problems, preventing wasted effort and ensuring changes deliver real impact.
This comprehensive guide moves beyond generic diagrams to provide actionable insights into the top 10 mapping methods. We will detail how each technique works, its specific applications, and crucial implementation tips. You’ll learn which tool to use for your unique challenge, from high-level SIPOC diagrams for stakeholder alignment to detailed Service Blueprints for optimizing the customer experience. This article provides the practical knowledge needed to transform complex, chaotic processes into streamlined, value-driven operations. You will leave with a clear understanding of how to select and apply the perfect mapping technique to drive efficiency and clarity within your organization.
1. Flowchart Mapping: The Universal Language of Process Flow
Flowcharting is arguably the most recognizable and fundamental of all business process mapping techniques. It provides a clear, sequential, and visual representation of a process from start to finish. By using a standardized set of symbols, it creates a universal language that team members across different departments can easily understand.
The technique’s primary strength lies in its simplicity. Ovals mark the beginning and end points, rectangles represent specific tasks or actions, and diamonds signify decision points where the path can branch. This structure makes it an ideal starting point for any process improvement initiative, as it clearly visualizes the “happy path” as well as potential bottlenecks or redundant steps. For example, a marketing team can use a flowchart to map the journey of a new lead from initial contact through qualification to handoff with sales, identifying every touchpoint and decision along the way.
When to Use This Technique
Flowchart mapping is exceptionally versatile but excels in specific scenarios:
- Onboarding and Training: Use flowcharts to provide new employees with a clear, step-by-step guide to core operational procedures.
- Process Documentation: It’s perfect for creating a definitive record of how a process currently operates, establishing a baseline for future analysis and improvement.
- Problem Identification: By visualizing the entire workflow, teams can easily spot illogical sequences, delays, or areas ripe for automation.
To help you quickly grasp the core components of this method, the summary box below highlights its foundational elements.
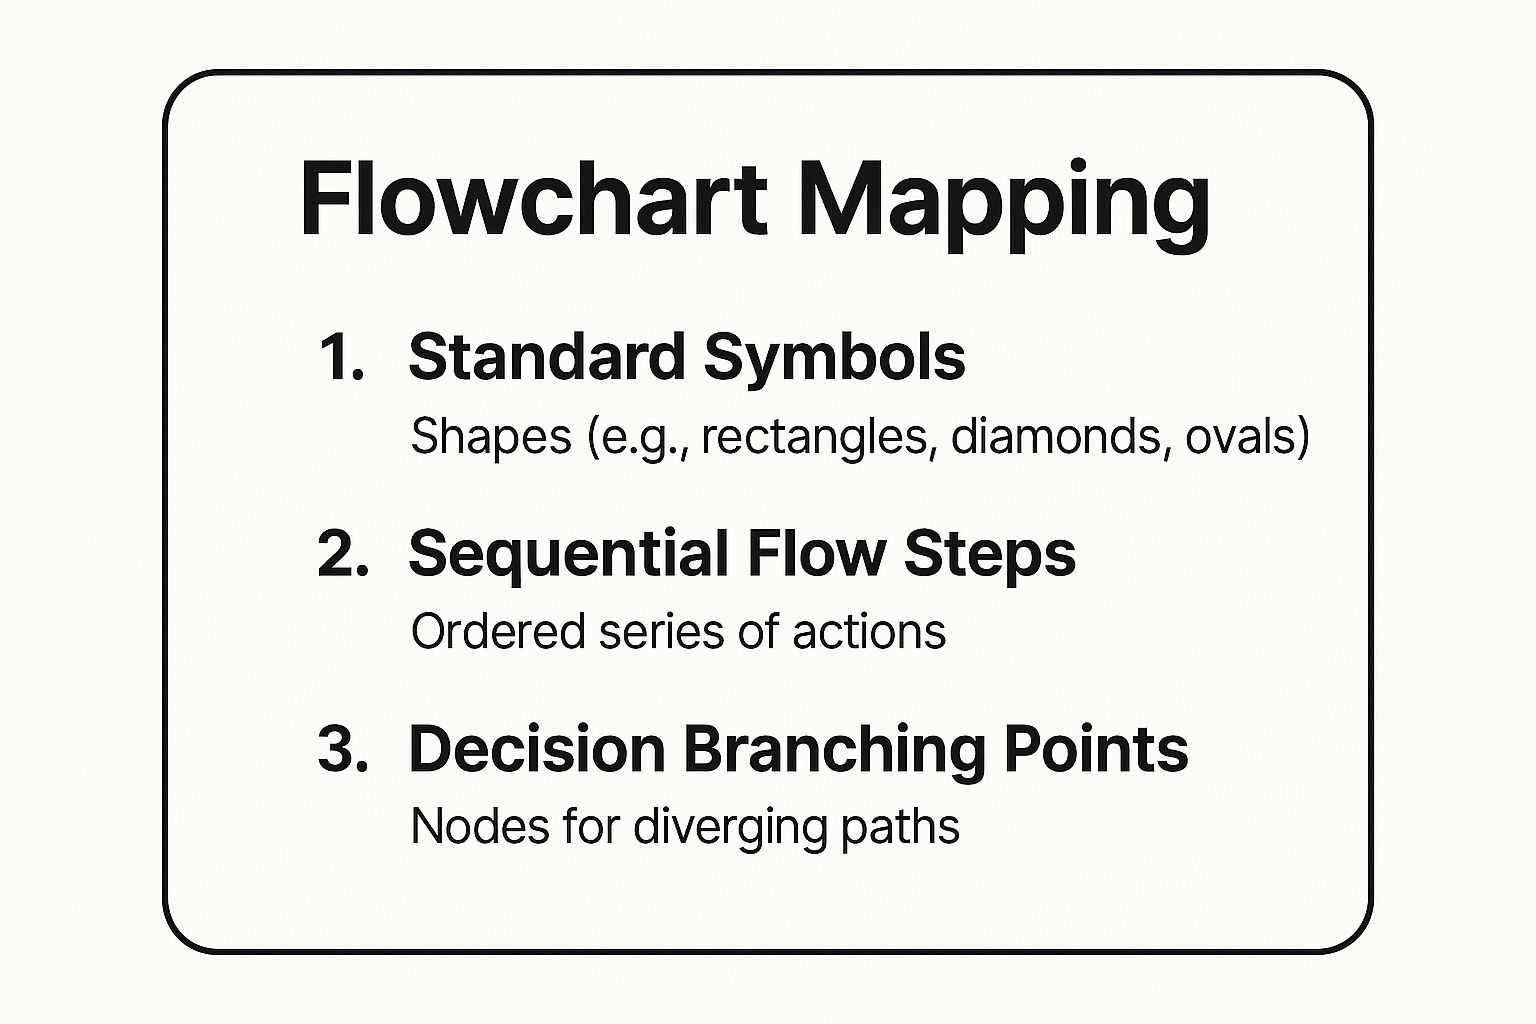
These three elements, symbols, sequence, and branching, form the backbone of any effective process flowchart, enabling clear communication and analysis.
Actionable Tips for Implementation
To maximize the effectiveness of your flowcharts, begin by mapping the main successful path before adding exceptions. Always validate the final map with the employees who perform the work daily to ensure its accuracy. Finally, keep each flowchart focused on a single process to maintain clarity and schedule regular reviews to keep it current.
2. Value Stream Mapping (VSM): Focusing on Customer Value
Originating from lean manufacturing, Value Stream Mapping (VSM) is a powerful business process mapping technique that visualizes the flow of materials and information needed to deliver a product or service to a customer. Its unique focus is on differentiating between value-added activities, those the customer is willing to pay for, and non-value-added activities, also known as waste.
VSM provides a holistic view of the entire process, from the initial customer request to final delivery. This birds-eye perspective is critical for identifying systemic inefficiencies like bottlenecks, excessive inventory, or wait times that often go unnoticed in more granular maps. For instance, Amazon uses VSM principles to scrutinize its fulfillment center operations, mapping every step from order receipt to package shipment to minimize lead time and eliminate waste, ensuring a superior customer experience.
When to Use This Technique
Value Stream Mapping is not for every scenario but is invaluable when the goal is strategic, customer-centric optimization. Use it for:
- Lean Initiatives: It is the foundational tool for any organization adopting lean principles to systematically identify and eliminate waste (Muda).
- Improving Customer Experience: When the primary goal is to reduce the total time it takes to fulfill a customer request, VSM helps pinpoint and shorten delays.
- Supply Chain Optimization: VSM is ideal for analyzing and improving the end-to-end flow of goods and information across multiple departments or even partner organizations.
To help you quickly grasp the core components of this method, the summary box below highlights its foundational elements.
These three elements, customer value, information flow, and material flow, are the cornerstones of VSM, guiding teams to optimize processes from the customer’s point of view.
Actionable Tips for Implementation
To implement VSM effectively, start by physically walking the process path to observe it firsthand. Involve the frontline employees who execute the tasks, as their insights are crucial. Focus on a single product or service family to keep the analysis manageable, and always use measured, real-world data for cycle times and delays, not estimates. Finally, create a “future state” map that sets clear, achievable targets for improvement.
3. Swimlane Diagrams: Clarifying Roles and Handoffs
Swimlane diagrams, also known as cross-functional flowcharts, are a powerful business process mapping technique that visually separates tasks by role, department, or system. The map is organized into parallel lanes, with each lane representing a distinct actor in the process. This format brilliantly illustrates not just the sequence of activities, but also who is responsible for each step and, crucially, how work is handed off between different parties.
The primary value of this technique is its ability to pinpoint inter-departmental friction. By mapping activities within their respective lanes, it becomes immediately obvious where delays occur, where communication breaks down, and where accountability is unclear. For instance, a manufacturing firm can map its order-to-cash process, with lanes for Sales, Finance, Production, and Logistics, to clearly identify the handoffs that slow down fulfillment and invoicing.
When to Use This Technique
Swimlane diagrams are most effective for analyzing complex processes that involve multiple teams or systems:
- Improving Cross-Functional Collaboration: Use them to identify and resolve bottlenecks or redundancies that occur when work moves between departments.
- Clarifying Roles and Responsibilities: Perfect for assigning clear ownership of tasks and preventing work from falling through the cracks.
- Onboarding for Complex Roles: Helps new hires understand not just their own tasks but also how their work fits into the larger organizational workflow.
Actionable Tips for Implementation
To create an effective swimlane diagram, start by clearly defining all actors (people, roles, or systems) and assigning each to a lane. Keep the diagram focused on a single process and use horizontal lines to represent handoffs, highlighting these critical touchpoints. It is vital to validate the map with each lane owner to ensure it accurately reflects reality. For readability, try to limit the number of lanes to between five and seven.
4. Business Process Model and Notation (BPMN): The Standard for Precision
Business Process Model and Notation, or BPMN, is a globally recognized standard among business process mapping techniques that provides a rich, graphical language for specifying business processes. Maintained by the Object Management Group (OMG), it offers a comprehensive set of symbols designed to bridge the communication gap between business stakeholders and the technical teams responsible for implementing the process.
The power of BPMN lies in its precision. While a simple flowchart might show a task, a BPMN diagram can specify the type of task (e.g., user, service, script), detail events that trigger it, and define complex gateways beyond simple yes/no decisions. This level of detail is crucial for complex operations like insurance claim processing or banking loan approvals, where accuracy and clear rules are non-negotiable. Its standardized nature makes it the go-to method for projects aiming for automation and systems integration.
When to Use This Technique
BPMN is not for every simple task; its strength is in complexity and standardization. It is best used for:
- Process Automation Projects: When a process is being designed for implementation in a Business Process Management (BPM) system or automation software.
- Complex Cross-Functional Workflows: For mapping intricate processes that involve multiple departments, systems, and external partners, such as in supply chain management.
- Compliance and Auditing: To create unambiguous, detailed documentation of processes that must adhere to strict regulatory standards.
For a deeper dive into the fundamentals of BPMN and its core components, the video below offers a clear and concise introduction.
Actionable Tips for Implementation
To implement BPMN effectively, start with the basic elements (events, activities, gateways) before incorporating more advanced symbols. Use different pools and lanes to clearly distinguish between participants or departments in a collaborative process. Most importantly, always validate the BPMN models with business stakeholders to ensure they accurately reflect business logic and requirements.
5. SIPOC Diagrams: Mapping the Process Ecosystem
A SIPOC diagram offers a high-level, panoramic view of a process by summarizing its core elements in a simple table. The acronym stands for Suppliers, Inputs, Process, Outputs, and Customers. Unlike more granular business process mapping techniques, its purpose isn’t to detail every step but to define the process’s scope and identify all key stakeholders and resources involved. This macro perspective is invaluable for aligning teams on a common understanding before diving into more complex analysis.
This technique is a cornerstone of the Six Sigma methodology, famously used by companies like General Electric and Motorola to scope improvement projects. By starting with a SIPOC, a project team can quickly establish process boundaries, agree on who provides the necessary inputs, and clarify who receives the outputs. For instance, an IT service management team can use a SIPOC to map the incident resolution process, identifying end-users as customers, support agents as suppliers of resolutions, and system alerts as inputs.
When to Use This Technique
SIPOC diagrams are most effective at the beginning of process improvement projects:
- Project Scoping: Use it to define the start and end points of a process you intend to analyze or improve, preventing scope creep.
- Stakeholder Identification: It clearly identifies all internal and external suppliers and customers, ensuring no key group is overlooked.
- High-Level Process Introduction: It’s perfect for introducing a complex process to team members or stakeholders who are unfamiliar with its specifics.
Beyond just visualizing, this level of process mapping, when combined with data analysis, becomes a powerful tool for understanding and enhancing operational efficiency, directly impacting how to effectively measure productivity at work.
Actionable Tips for Implementation
To create a powerful SIPOC diagram, start by defining the process with 5-7 high-level steps. Work from the center (Process) outwards to Inputs/Outputs and then Suppliers/Customers. Be sure to validate the completed diagram with key stakeholders to confirm its accuracy and use it as the foundational context for more detailed mapping techniques like flowcharts or value stream maps.
6. Process Flow Analysis: Adding Data to the Diagram
Process Flow Analysis elevates standard mapping by integrating quantitative data and analytical methods. It’s a systematic approach that moves beyond simply visualizing steps to measuring and scrutinizing the flow of work, materials, or information. This technique combines a process map with performance metrics to uncover deep, evidence-based insights.
The core strength of this method is its data-driven nature. Instead of relying on assumptions, teams use real-world data to analyze cycle times, throughput, resource utilization, and costs associated with each step. For example, a hospital can analyze its emergency department flow not just by mapping patient steps but by attaching average wait times and treatment durations to each stage. This pinpoints the exact source of delays, such as a bottleneck in the radiology department, and quantifies its impact.
When to Use This Technique
Process Flow Analysis is most powerful when you need to optimize for efficiency and performance:
- Performance Measurement: Use it to establish quantitative baselines and track the impact of changes over time with hard data.
- Constraint Management: It’s ideal for identifying the single biggest constraint (bottleneck) in a system that limits overall output.
- Resource Optimization: Perfect for analyzing if resources like staff or machinery are being overutilized or underutilized, allowing for better allocation.
This analytical approach ensures that improvement efforts are focused on the areas that will yield the greatest return, transforming process mapping from a descriptive exercise into a prescriptive tool.
Actionable Tips for Implementation
To implement Process Flow Analysis effectively, collect actual performance data rather than relying on estimates. Use statistical tools to identify patterns and variations in your workflow. Most importantly, focus on identifying and managing the primary constraints within the process, as improving non-constraint areas often yields minimal overall benefit. Always involve operational personnel to validate the data and proposed scenarios.
7. Detailed Process Maps: The Blueprint for Operational Excellence
While many business process mapping techniques focus on a high-level view, Detailed Process Maps dive into the granular specifics of a workflow. This technique involves creating a comprehensive, microscopic documentation of a process, capturing every single step, decision point, exception path, and system interaction. It serves as the ultimate source of truth for how work actually gets done.
The power of this method lies in its thoroughness. It leaves no room for ambiguity, making it essential for highly regulated or complex environments. For instance, a pharmaceutical company would use a detailed map to document every step of a drug manufacturing process to comply with FDA regulations, ensuring safety and consistency. Similarly, financial institutions map compliance procedures in minute detail to prevent costly errors and meet legal requirements.
When to Use This Technique
This in-depth approach is most valuable in specific, high-stakes situations:
- Regulatory Compliance: Essential for industries where strict adherence to documented procedures is legally mandated, like finance or healthcare.
- Complex Process Standardization: Ideal for standardizing intricate workflows, such as complex manufacturing assemblies or multi-stage customer service protocols.
- Automation Initiatives: Provides the necessary detail for developers and analysts to successfully automate a process, ensuring all exceptions are handled.
The goal is to build an exhaustive blueprint that can be used for training, auditing, and continuous improvement. To learn more about creating such comprehensive documentation, you can explore detailed business process documentation templates on resolution.de.
Actionable Tips for Implementation
To create effective detailed maps, start with a hierarchical approach, beginning with a high-level overview before drilling down into specifics. Always involve the process owners and frontline employees in validating the map to guarantee its accuracy and completeness. Crucially, spend time documenting all possible exception scenarios, as this is where many processes fail. Finally, link your map to supporting documents and establish a regular review cycle to keep it relevant.
8. Cross-Functional Process Maps: Visualizing Team Handoffs
Cross-functional process mapping is a vital technique that specifically visualizes workflows spanning multiple departments or business functions. Often called swimlane diagrams, these maps organize process steps into horizontal or vertical “lanes,” with each lane representing a distinct team, role, or even system. This structure provides unparalleled clarity on who does what and where critical handoffs occur.
The primary strength of this method is its ability to expose inter-departmental friction. It clearly illustrates dependencies, delays, and communication breakdowns that are invisible in simpler diagrams. For instance, a company can map its customer complaint resolution process, with lanes for Customer Support, Technical Escalations, and Finance. This map would immediately highlight how long it takes for information to move between teams and where the process stalls, making it one of the most effective business process mapping techniques for improving collaboration.
When to Use This Technique
This method is indispensable when a process involves multiple stakeholders and handoffs:
- Improving Collaboration: Use it to clarify roles and responsibilities in complex projects like new product development or strategic planning cycles.
- Eliminating Bottlenecks: It’s perfect for identifying where work queues up between departments, such as in a supplier onboarding or order-to-cash process.
- Enhancing Customer Experience: Map customer-facing workflows to ensure seamless transitions between sales, service, and billing teams, preventing a disjointed experience.
To implement this technique effectively, focusing on the interactions between teams is paramount.
Actionable Tips for Implementation
To maximize the impact of your cross-functional maps, ensure you include representatives from every involved department during the mapping session. Focus the analysis on how each step contributes to delivering value to the end customer. Actively seek to identify and eliminate redundant or unnecessary handoffs, and use the map as a tool to establish shared accountability measures that bridge departmental divides.
9. Opportunity Maps: Visualizing the Path to Improvement
Opportunity mapping elevates a standard process map from a simple “as-is” diagram to a strategic tool for transformation. This technique involves overlaying a visual process model with data-driven insights about pain points, bottlenecks, improvement opportunities, and optimization potential. Instead of just showing how a process works, it explicitly highlights where it can be made better.
The power of this method is its focus on future value. By color-coding or annotating specific steps with metrics like cost, time, or customer satisfaction scores, teams can instantly see the most impactful areas for change. For instance, a manufacturing firm could map its production line and mark steps with high defect rates or long cycle times, creating a clear visual guide for its cost-reduction initiatives. This makes it one of the most action-oriented business process mapping techniques for driving tangible business outcomes.
When to Use This Technique
Opportunity mapping is a strategic tool best used for specific, high-impact goals:
- Digital Transformation: Use it to identify manual, repetitive tasks that are prime candidates for automation or new software implementation.
- Cost Reduction Initiatives: Pinpoint high-cost activities, resource-intensive steps, or wasteful redundancies that can be streamlined or eliminated.
- Customer Experience Programs: Overlay customer feedback and satisfaction data onto process maps to find and fix moments of friction in the customer journey.
To learn more about how to turn these identified opportunities into concrete results, you can explore various process improvement techniques. These methods provide the framework for acting on the insights your opportunity map reveals.
Actionable Tips for Implementation
To build an effective opportunity map, start by collecting both quantitative data (e.g., cycle times, error rates) and qualitative feedback from frontline employees. Prioritize opportunities by categorizing them into quick wins and long-term strategic projects. Most importantly, ensure that every identified opportunity aligns directly with overarching business goals, such as increasing revenue or improving efficiency, to secure stakeholder buy-in.
10. Service Blueprints: Visualizing the Complete Service Experience
Service Blueprints are a specialized business process mapping technique designed to visualize the entire service delivery ecosystem from the customer’s perspective. It goes beyond a simple process map by connecting visible customer actions with the invisible backstage activities, employee actions, and support systems required to make the service a reality. This holistic view reveals the intricate dependencies between customer experience and internal operations.
The power of a service blueprint lies in its layered structure, which typically includes lines for customer actions, frontstage (visible) employee actions, backstage (invisible) employee actions, and supporting processes. For example, a hotel can map a guest’s check-in journey, showing their interaction with the front desk (frontstage), the reservation system being updated (backstage), and the IT support maintaining that system (support). This reveals potential failure points that could impact the guest experience. For those interested in delving deeper into customer experience mapping, considering Jim Kalbach’s work on experience mapping can provide invaluable insights.
When to Use This Technique
Service blueprints are indispensable for service-oriented businesses aiming for excellence:
- Service Design and Innovation: Use it to design new services or redesign existing ones by understanding all operational and customer-facing components.
- Identifying Failure Points: It clearly highlights “moments of truth” and potential bottlenecks where service delivery can break down, both visibly and invisibly.
- Cross-Functional Alignment: It’s perfect for getting teams from different departments, like marketing, operations, and IT, on the same page about how a service is delivered.
This comprehensive approach helps organizations build more robust and customer-centric services. You can learn more about how to get started with this method by exploring customer experience mapping resources.
Actionable Tips for Implementation
To create an effective service blueprint, start by mapping the critical customer touchpoints from their perspective before adding internal layers. Incorporate the customer’s emotional journey at each step to identify pain points and opportunities for delight. Finally, use direct customer feedback and involve employees from both frontstage and backstage roles to validate the blueprint and ensure its accuracy.
12. Cause and Effect Diagram: Uncovering the Root of Process Problems
A Cause and Effect Diagram, also known as an Ishikawa or Fishbone Diagram, is one of the most effective business process mapping techniques for root cause analysis. It visually organizes potential causes of a specific problem or effect, helping teams move beyond surface-level symptoms to find the foundational issues. The “head” of the fish represents the problem statement, while the “bones” extending from the spine represent major categories of potential causes.
This technique encourages comprehensive brainstorming by structuring the investigation around key areas, often categorized using the 6Ms: Manpower, Method, Machine, Material, Measurement, and Mother Nature (Environment). For example, if a software development team is experiencing frequent production bugs (the effect), they can use a Fishbone Diagram to explore causes related to inadequate training (Manpower), flawed coding standards (Method), or faulty testing servers (Machine). This structured approach ensures no potential cause is overlooked.
When to Use This Technique
This diagram is most powerful when you need to dig deep into a known issue:
- Problem-Solving Workshops: Use it to guide a team through a structured brainstorming session to identify all possible causes of a recurring process failure.
- Quality Improvement: It’s a cornerstone of quality management for investigating defects in manufacturing or service delivery.
- Post-Mortem Analysis: When a project or initiative fails, a Cause and Effect Diagram can help analyze what went wrong in a non-confrontational, systematic way.
The summary box below outlines the core components that make this technique a premier tool for investigative process analysis.

These three elements, Problem, Categories, and Causes, work in concert to provide a detailed, hierarchical view of the factors contributing to a single process outcome.
Actionable Tips for Implementation
To get the most from a Cause and Effect Diagram, start with a clearly defined and agreed-upon problem statement. Encourage the team to ask “Why?” multiple times for each potential cause to drill down to the root. Finally, once the diagram is complete, use it to prioritize which potential causes to investigate further, focusing on those with the highest likely impact.
12 Business Process Mapping Techniques Comparison
| Technique | Implementation Complexity 🔄 | Resource Requirements ⚡ | Expected Outcomes 📊 | Ideal Use Cases 💡 | Key Advantages ⭐ |
|---|---|---|---|---|---|
| Flowchart Mapping | Low 🔄 | Low ⚡ | Clear, step-by-step process visualization 📊 | Simple sequential processes, high-level and detailed | Universal understanding, simple to create ⭐ |
| Value Stream Mapping (VSM) | High 🔄 | High ⚡ | Identifies waste; lean process improvement 📊 | Lean manufacturing, customer value optimization | Quantitative data; aligns with customer value ⭐ |
| Swimlane Diagrams | Medium 🔄 | Medium ⚡ | Visualizes handoffs, accountability 📊 | Cross-functional and departmental workflows | Clarifies roles and communication gaps ⭐ |
| BPMN (Business Process Model and Notation) | High 🔄 | Medium to High ⚡ | Detailed, precise, supports automation 📊 | Complex processes requiring business-IT alignment | Industry standard; scalable; supports automation ⭐ |
| SIPOC Diagrams | Low 🔄 | Low ⚡ | High-level process overview and scoping 📊 | Project scoping; process boundary definition | Fast to create; promotes stakeholder alignment ⭐ |
| Process Flow Analysis | High 🔄 | High ⚡ | Data-driven insights, bottleneck identification 📊 | Performance measurement; capacity planning | Analytical depth; supports resource optimization ⭐ |
| Detailed Process Maps | High 🔄 | Medium to High ⚡ | Complete process documentation 📊 | Regulatory compliance; training; automation planning | Comprehensive detail; supports standardization ⭐ |
| Cross-Functional Process Maps | Medium to High 🔄 | Medium ⚡ | Reveals silo effects; improves collaboration 📊 | Multi-departmental process improvement | Enhances coordination and breaks down silos ⭐ |
| Opportunity Maps | Medium 🔄 | Medium ⚡ | Highlights improvement and investment areas 📊 | Strategic process improvement and prioritization | Focuses on high-impact opportunities ⭐ |
| Service Blueprints | Medium 🔄 | Medium to High ⚡ | Customer journey and service delivery insight 📊 | Service organizations; customer experience design | Bridges operations and customer focus ⭐ |
Choosing the Right Technique to Build Your Process Powerhouse
We have journeyed through a comprehensive landscape of business process mapping techniques, from the foundational simplicity of Flowcharts to the intricate, customer-centric detail of Service Blueprints. The sheer variety can seem daunting, but the power lies not in mastering every single one, but in understanding which tool to deploy for the specific challenge your team faces. This strategic selection is the critical bridge between simply drawing diagrams and architecting a truly efficient, agile, and resilient operational framework.
The core lesson is to always lead with your objective. Before a single shape is drawn or a single arrow is placed, you must ask: “What problem are we trying to solve?” The answer to this question is your compass, guiding you toward the most effective technique. A process map is not merely a static document; it’s a dynamic asset, a shared language that breaks down silos and fosters a culture of continuous improvement across your entire organization.
From Theory to Action: Synthesizing Your Toolkit
Recapping the powerful tools at your disposal, remember to align the technique with your intended outcome. Is your goal to achieve a high-level consensus on project scope with stakeholders? A SIPOC Diagram is your best starting point. Are you a DevOps manager aiming to slash lead time and eliminate waste in your deployment pipeline? Value Stream Mapping (VSM) provides the lean-focused lens you need.
Conversely, if a customer support team is struggling with inconsistent service delivery and disjointed handoffs, a Service Blueprint will illuminate both the onstage and backstage actions that shape the customer experience. For Jira administrators and project managers needing to clarify roles and responsibilities within a complex workflow, a Swimlane Diagram or a Cross-Functional Process Map offers unparalleled clarity, ensuring every team member knows exactly what they own.
Key Insight: The most successful organizations don’t just “do” process mapping; they integrate it into their operational DNA. They treat their process maps as living documents, revisited and refined as the business evolves, ensuring that efficiency is not a one-time project but an ongoing commitment.
Your Next Steps on the Path to Process Excellence
Armed with this knowledge, your path forward is clear. Don’t let analysis paralysis stall your progress. The journey from process chaos to operational clarity begins with a single, well-chosen map. Start small, pick a high-impact or notoriously problematic process, and commit to visualizing it.
Follow these actionable steps to embed these practices into your team’s workflow:
- Identify a Critical Process: Select a process that is causing friction, generating customer complaints, or known for its inefficiency. A tangible pain point provides a powerful motivation for mapping.
- Define Your Goal: Be explicit about what you want to achieve. Are you aiming to reduce cycle time by 20%, decrease error rates, or improve team collaboration? A clear goal will dictate your choice of business process mapping techniques.
- Assemble a Cross-Functional Team: Involve individuals from every stage of the process. From the sales team using HubSpot to the DevOps team in Jira, diverse perspectives are essential for uncovering hidden inefficiencies and gaining buy-in.
- Choose Your Weapon: Based on your goal and the complexity of the process, select the appropriate mapping technique from this guide. Start with a simpler one like a Flowchart or Swimlane Diagram if you’re new to the practice.
- Map, Analyze, and Iterate: Facilitate a mapping session to document the “as-is” process. Once visualized, analyze it for bottlenecks, redundancies, and opportunities for improvement. From there, you can collaboratively design the “to-be” process and create an action plan for implementation.
Mastering these techniques transforms you from a manager into a process architect. You gain the ability to not only solve problems but to proactively design systems that prevent them from occurring. This is how you build a process powerhouse: one map, one improvement, one breakthrough at a time. The ultimate reward is an organization that runs smoother, scales faster, and delivers exceptional value to both its customers and its employees.
As you map your complex workflows, especially those spanning across different departments like sales in HubSpot and development in Jira, ensuring seamless data flow is paramount. The integration solutions from resolution Reichert Network Solutions GmbH help bridge these gaps, turning your idealized process maps into automated, real-world efficiencies. Explore how to connect your critical tools and bring your process improvements to life at resolution Reichert Network Solutions GmbH.
