

Beyond the Queue: Why Every Click and Call Counts
Your help desk is more than just a problem-solving queue; it’s a critical data source for understanding customer health, agent performance, and product stability. To harness this data effectively, you need to move beyond simply counting tickets. This requires tracking the right help desk KPI (Key Performance Indicator) metrics that reveal the true efficiency and impact of your support operations.
But which KPIs actually matter? With dozens of potential metrics to monitor, focusing on the wrong ones can lead to wasted effort and misguided strategies. This guide cuts through the noise. We will provide a curated list of the most essential help desk KPIs that every support team, from customer service agents to Jira administrators, should be tracking.
For each KPI, you’ll get a clear definition, industry benchmarks, and actionable advice on why it’s important and how to improve it. We’ll also cover practical implementation details, including how tools like the HubSpot for Jira integration can connect your support and development data for a complete operational view. You will leave with a clear roadmap for measuring what truly drives customer satisfaction and operational excellence.
1. First Call Resolution (FCR)
First Call Resolution (FCR), also known as First Contact Resolution, is a cornerstone help desk KPI. It measures the percentage of support tickets resolved by agents during the very first interaction with a user. This means the customer’s issue is completely solved without needing a callback, a ticket transfer, or any further follow-up. A high FCR rate is a powerful indicator of an efficient, knowledgeable support team.

Why FCR is a Critical Help Desk KPI
FCR directly impacts both customer satisfaction and operational efficiency. When users get their problems solved quickly, their satisfaction soars, and their perception of your brand improves. Internally, a high FCR reduces the number of repeat contacts, freeing up agent time and lowering operational costs. Companies known for stellar service, like Zappos and Apple, often report FCR rates above 80%, demonstrating its link to a positive customer experience.
How to Improve Your FCR Rate
Boosting your FCR involves empowering your agents with the right tools and knowledge. Focus on these actionable strategies:
- Invest in a Robust Knowledge Base: Equip your team with a comprehensive, easily searchable knowledge base. This allows agents to find accurate solutions quickly without needing to escalate.
- Implement Real-Time Support Tools: Use decision-support tools or AI assistants that can guide agents through complex troubleshooting steps during a call.
- Track FCR by Issue Type: Analyzing FCR for different categories of problems helps you identify areas where your team needs more training or where documentation is lacking. For example, if FCR is low for “billing inquiries,” you can create specific training modules to address it.
- Use Post-Interaction Surveys: Immediately after a call, send a simple one-question survey (“Was your issue fully resolved today?”) to confirm the resolution from the customer’s perspective. This provides a more accurate FCR measurement than just relying on agent-closed tickets.
2. Average Response Time
Average Response Time is a fundamental help desk KPI that measures the mean duration from when a customer submits a support request to when an agent provides their first, non-automated response. This metric is a direct reflection of your team’s attentiveness and speed. A low average response time shows customers that their issues are seen and acknowledged promptly, which is a critical first step in building a positive support experience.
Why Average Response Time is a Critical Help Desk KPI
This KPI directly correlates with customer satisfaction. In an era of instant communication, long waits for a simple acknowledgment can lead to frustration and churn. Tracking response time helps you set and meet customer expectations, ensuring users feel valued from the moment they reach out. For example, Amazon Web Services (AWS) sets aggressive sub-15 minute response time targets for business-critical issues, understanding that speed is paramount. Monitoring this KPI helps prevent minor issues from escalating due to perceived neglect.
How to Improve Your Average Response Time
Reducing your response time involves a combination of smart automation, clear processes, and strategic resource allocation. Focus on these actionable strategies:
- Set Tiered Response Time SLAs: Not all tickets are equal. Establish different response time goals based on issue priority (e.g., critical, high, normal, low). This ensures your team focuses its immediate attention where it’s needed most.
- Use Automated Acknowledgments Wisely: While the KPI measures human response, an automated email confirming ticket receipt can manage expectations. It reassures the customer their message was received and provides an estimated response window.
- Monitor by Channel: Analyze response times separately for email, chat, and phone. This helps you identify bottlenecks in specific channels and allocate staff accordingly. For instance, you may need more agents on live chat during peak hours.
- Implement Escalation Triggers: Use your help desk software to create automated alerts for agents and managers when a ticket is approaching its SLA response time limit. This proactive measure helps prevent breaches before they happen.
3. Customer Satisfaction Score (CSAT)
Customer Satisfaction Score, or CSAT, is a fundamental help desk KPI that directly measures how happy a customer is with a specific interaction or the overall service they received. It is typically captured through a simple, post-interaction survey asking users to rate their satisfaction on a scale, often from 1 to 5 (e.g., “Very Dissatisfied” to “Very Satisfied”). This metric provides immediate, direct feedback from the end-user’s perspective, making it invaluable for any customer-centric support team.

Why CSAT is a Critical Help Desk KPI
Unlike internal efficiency metrics, CSAT provides a clear view of service quality through the customer’s eyes. A high CSAT score indicates that your help desk is not just closing tickets, but also effectively meeting customer expectations and creating positive experiences. For example, brands renowned for their support, like HubSpot, report impressive CSAT scores of 96% for their customer success teams. This focus on satisfaction helps build customer loyalty, reduce churn, and pinpoint specific agents or processes that require improvement.
How to Improve Your CSAT Score
Improving CSAT requires a commitment to listening to feedback and acting on it swiftly. Focus on these key strategies to enhance customer satisfaction:
- Deploy Immediate, Simple Surveys: Send a CSAT survey the moment a ticket is resolved. Keep it short, ideally a single question about satisfaction followed by an optional comment field. This maximizes response rates while the experience is still fresh.
- Follow Up on Negative Feedback: Actively monitor low scores. Designate a team lead or senior agent to personally contact dissatisfied customers to understand the root cause of their issue and offer a solution. This can turn a negative experience into a positive one.
- Analyze Qualitative Comments: Don’t just look at the numbers. The comments left by customers provide rich, actionable insights into what you’re doing well and where you’re falling short. Use this data to inform training and process improvements.
- Recognize and Reward High Performers: Publicly acknowledge agents who consistently receive high CSAT scores. This not only motivates the individual but also sets a standard of excellence for the entire team to follow.
4. Average Resolution Time
Average Resolution Time (ART), sometimes called Mean Time to Resolution (MTTR), is a fundamental help desk KPI that measures the total time elapsed from the moment a user creates a ticket until it is fully resolved and closed. It provides a high-level view of your team’s overall efficiency and the complexity of the issues they handle. A lower ART generally signals a more effective support process, but it must be balanced with the quality of the resolution.
Why Average Resolution Time is a Critical Help Desk KPI
This KPI is crucial for managing customer expectations and assessing internal process effectiveness. A long resolution time can lead to user frustration and disrupt their workflow, negatively impacting satisfaction. For managers, tracking ART helps identify bottlenecks in the support pipeline, highlight complex issue types that require more resources, and justify headcount or tool investments. For instance, Atlassian aims to resolve 80% of its issues in under 24 hours, demonstrating a commitment to speedy, effective support that minimizes customer downtime.
How to Improve Your Average Resolution Time
Reducing your ART requires a strategic approach that streamlines workflows and empowers agents. Here are some effective tactics:
- Segment by Priority and Category: Not all tickets are equal. Track ART separately for different issue types (e.g., bug report vs. password reset) and priority levels (e.g., low vs. critical). This provides a more accurate picture of performance and helps you set realistic targets.
- Leverage Automation for Triage: Use automation rules to route tickets to the correct agent or team instantly. This eliminates manual triage delays and ensures the right expert sees the issue from the start.
- Implement a Knowledge Management System: A well-maintained knowledge base allows agents to find proven solutions quickly instead of reinventing the wheel for common problems. This directly accelerates the resolution process.
- Set Realistic Service Level Agreements (SLAs): Use historical data to establish achievable resolution time targets. Clear SLAs help manage both customer expectations and internal agent performance, ensuring focus is placed where it’s needed most.
5. Ticket Volume
Ticket Volume is a foundational help desk KPI that measures the total number of support requests your team receives over a given period, such as a day, week, or month. This metric acts as the primary gauge of demand for your support services. Tracking it provides essential data for resource allocation, workload management, and identifying broader trends that impact your customer base.
Why Ticket Volume is a Critical Help Desk KPI
Monitoring Ticket Volume is crucial for operational health and strategic planning. A sudden spike in tickets can signal a service outage, a bug in a new software release, or a confusing marketing campaign. Consistently high volume might indicate a need for more staff or better self-service resources. For example, large-scale operations like Microsoft, which handles over a million support cases monthly, rely on this data to manage a massive global support infrastructure. Similarly, a company like Slack, processing around 50,000 requests monthly, uses volume data to ensure its 200+ agents are staffed appropriately across different shifts and regions.
How to Improve Your Ticket Volume Management
Effectively managing Ticket Volume isn’t about simply reducing the number but about understanding and controlling the flow of requests. Here are some strategies:
- Track Volume Trends Over Time: Analyze ticket volume daily, weekly, and monthly to identify predictable patterns. Do tickets spike after a new product launch or at the end of a billing cycle? Recognizing these trends allows you to proactively adjust staffing.
- Segment by Issue Type and Channel: Break down your total volume by problem category (e.g., password resets, billing questions) and by channel (e.g., email, phone, chat). This helps you pinpoint the biggest drivers of support demand and allocate resources to create targeted solutions, like a detailed FAQ for common issues.
- Implement Proactive Self-Service: To manage high volume for routine requests, invest in robust self-service options like a knowledge base, community forums, or chatbots. This deflects simple tickets, freeing up agents to handle more complex problems.
- Monitor for Anomaly Detection: Use your help desk software to set up alerts for unusual spikes in ticket volume. A sudden increase is often the first sign of a systemic issue, and rapid detection allows your technical teams to begin investigating and resolving it faster, minimizing customer impact.
6. Escalation Rate
Escalation Rate measures the percentage of support tickets that cannot be resolved at the initial support level and must be transferred to a higher tier or a different department. This crucial help desk KPI provides insight into the effectiveness of your first-level support agents, the quality of your knowledge base, and whether issues are being routed correctly from the start. A low escalation rate generally indicates a well-trained front-line team, but it should not be so low that complex issues are mishandled.
The following bar chart illustrates healthy escalation rate ranges between different support tiers, offering a benchmark for performance.
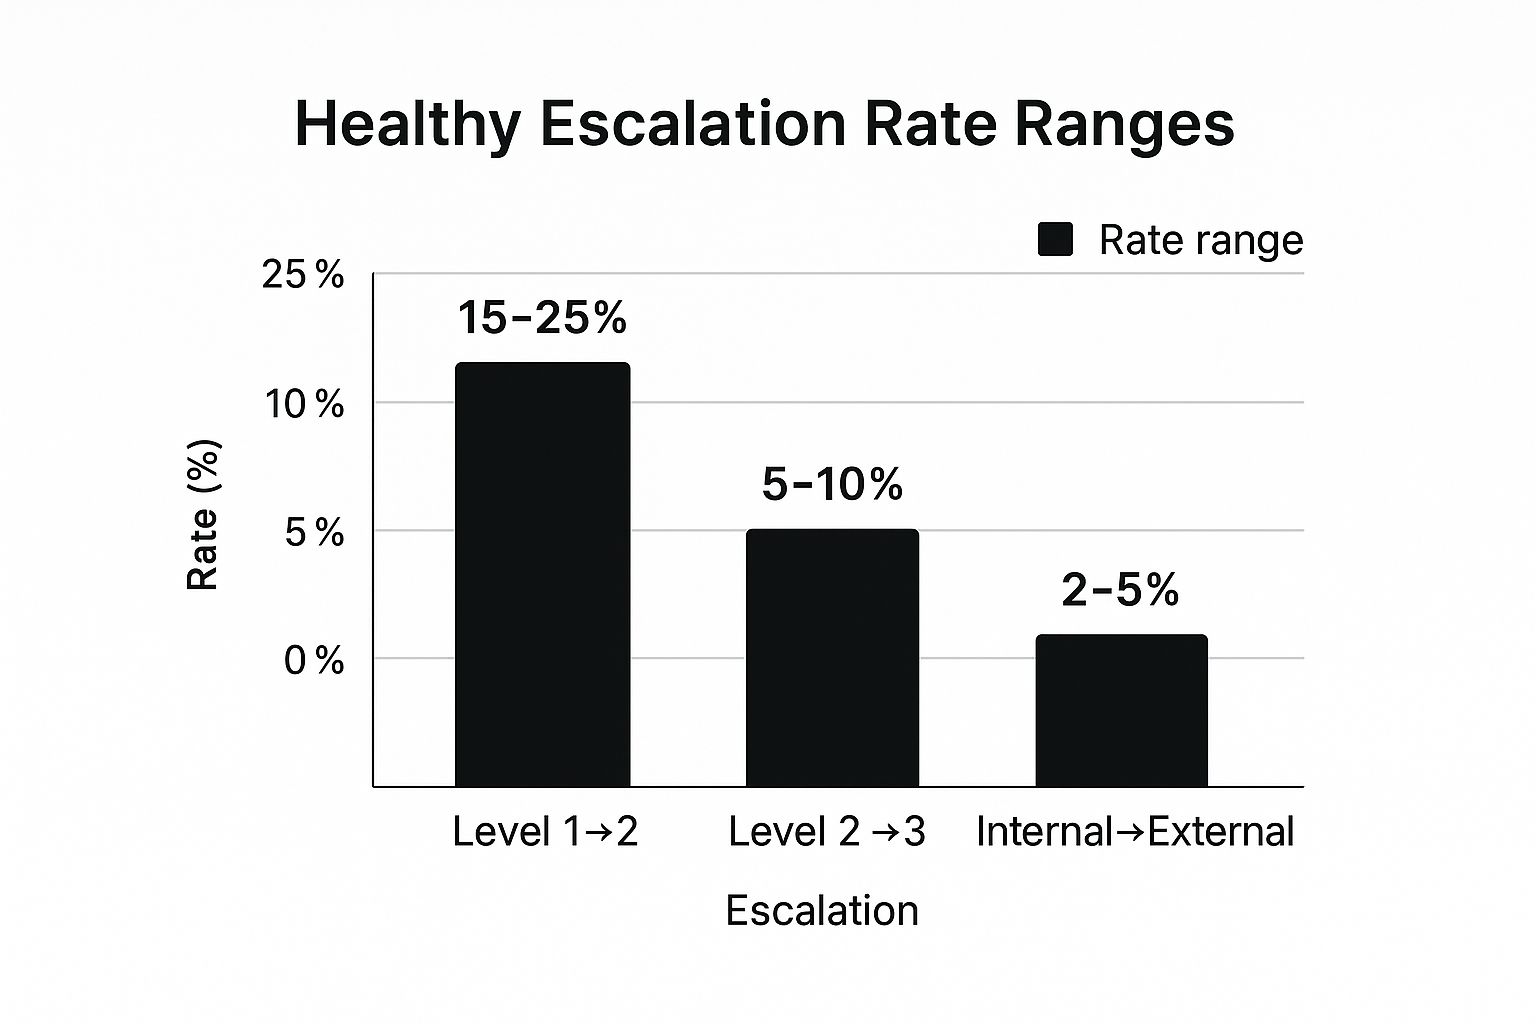
The chart shows that as issues move to higher, more specialized tiers, the expected escalation percentage naturally decreases, reflecting a well-structured support system.
Why Escalation Rate is a Critical Help Desk KPI
Monitoring your escalation rate is vital for balancing resolution quality with operational efficiency. While a high rate might signal gaps in front-line training or resources, a rate that is too low could mean agents are attempting to solve problems beyond their expertise, leading to longer resolution times and lower customer satisfaction. Companies like Dell’s enterprise support aim for escalation rates under 20% by investing heavily in agent training, ensuring front-line teams are equipped to handle a wide array of technical challenges.
How to Improve Your Escalation Rate
Optimizing your escalation rate involves a strategic approach to agent enablement and process refinement. Focus on these actionable strategies:
- Track Escalation Reasons: Implement a system where agents must log a specific reason for every escalation. Analyzing this data reveals common knowledge gaps, product issues, or process deficiencies that need to be addressed.
- Provide Targeted Training: Use the insights from escalation pattern analysis to develop regular, focused training sessions. If many tickets related to “software configuration” are being escalated, create dedicated workshops on that topic.
- Implement Clear Escalation Criteria: Establish and document clear, unambiguous rules for when a ticket should be escalated. This prevents agents from holding onto tickets for too long or escalating issues prematurely.
- Balance with Quality Metrics: Always analyze the escalation rate alongside metrics like Customer Satisfaction (CSAT). This ensures that a drive to lower escalations does not negatively impact the quality of the final resolution. For more details on creating a structured workflow, you can learn more about building an effective issue escalation process on resolution.de.
7. Cost Per Ticket
Cost Per Ticket is a vital financial help desk KPI that calculates the total expense associated with resolving a single support request. This metric encompasses all direct and indirect costs, including agent salaries and benefits, technology licensing fees, and a portion of overhead like facilities and utilities. A clear understanding of your Cost Per Ticket is essential for budgeting, demonstrating the IT department’s value, and making strategic decisions about resource allocation and technology investments.
Why Cost Per Ticket is a Critical Help Desk KPI
Tracking Cost Per Ticket provides a clear view of your help desk’s operational efficiency from a financial perspective. It helps leaders identify inefficiencies and justify investments in automation, training, or new tools that can drive down expenses without sacrificing service quality. For instance, Gartner reports that the average Cost Per Ticket can range widely from $15 to $70, depending on the complexity and channel. Success stories, like IBM achieving a 30% cost reduction by automating routine requests, highlight how focusing on this KPI can yield significant financial benefits.
How to Reduce Your Cost Per Ticket
Lowering this metric requires a strategic approach that balances cost-saving measures with maintaining high-quality support. Focus on these actionable strategies:
- Calculate All-Inclusive Costs: For an accurate measurement, be sure to include all relevant cost components. This means factoring in not just agent salaries, but also benefits, software licenses (for ticketing, remote access, etc.), hardware depreciation, and a portion of facility overhead.
- Analyze Costs by Channel: Your Cost Per Ticket will likely vary significantly between channels like phone, email, and self-service portals. Calculate the cost for each channel to identify which are most efficient and where you should guide users for certain issue types.
- Implement Automation and AI: Automate the handling of common, repetitive requests like password resets or account lockouts. Implementing AI-powered chatbots, as American Express did to reduce their cost per contact by 25%, can deflect simple tickets and free up agents for more complex issues.
- Balance Cost with Quality: A low Cost Per Ticket is meaningless if customer satisfaction plummets. Track this KPI alongside metrics like CSAT and FCR to ensure your cost-reduction efforts are not negatively impacting the user experience. You can find more ideas in this guide to IT cost reduction strategies on resolution.de.
8. Agent Utilization Rate
The Agent Utilization Rate is a crucial operational help desk KPI that measures the percentage of an agent’s logged-in time spent on support-related activities. These activities include handling calls, responding to emails, participating in live chats, and performing after-call work. It’s a key metric for workforce management, helping leaders understand productivity and ensure staffing levels are optimized. A balanced utilization rate indicates an efficient team that isn’t overworked or underused.
Why Agent Utilization Rate is a Critical Help Desk KPI
This metric provides direct insight into your team’s efficiency and workload capacity. A low rate might suggest overstaffing or systemic inefficiencies, while an excessively high rate can lead to agent burnout and a decline in service quality. For example, industry leaders like Genesys and LivePerson aim for rates between 75-85%, a range that signifies high productivity while leaving room for essential non-direct tasks like training and breaks. Tracking this KPI helps you manage resources effectively, ensuring you get the most value from your support staff without sacrificing their well-being or customer satisfaction. For a deeper dive into managing your team’s capacity, you can learn more about IT resource management.
How to Improve Your Agent Utilization Rate
Optimizing your Agent Utilization Rate is about finding a sustainable balance between productivity and quality. Focus on these actionable strategies:
- Define “Productive Time” Clearly: Ensure your definition includes all relevant tasks, such as direct customer interaction, ticket documentation, and follow-up activities. Excluding key tasks will give you an inaccurate picture.
- Balance with Quality Metrics: Never monitor utilization in a vacuum. Track it alongside Customer Satisfaction (CSAT) and First Call Resolution (FCR) to ensure that a push for higher productivity isn’t negatively impacting the quality of service.
- Use Workforce Management (WFM) Tools: Implement WFM software to forecast ticket volume and schedule agents more effectively. These tools help align staffing with demand, preventing both underutilization during slow periods and burnout during peaks.
- Account for All Activities: A healthy utilization rate accounts for breaks, training, team meetings, and administrative tasks. Aiming for 100% utilization is unrealistic and detrimental, so target a balanced rate like 80% to ensure agents have time to recharge and develop their skills.
Help Desk KPI Performance Comparison
| KPI | Implementation Complexity 🔄 | Resource Requirements ⚡ | Expected Outcomes 📊 | Ideal Use Cases 💡 | Key Advantages ⭐ |
|---|---|---|---|---|---|
| First Call Resolution (FCR) | Medium – requires training & monitoring | Moderate – skilled agents & tools | Higher customer satisfaction, reduced repeat contacts | Improving agent knowledge and immediate resolutions | Reduces costs, improves productivity, boosts morale |
| Average Response Time | Low – straightforward tracking | Low to Moderate – staffing & automation | Faster acknowledgments, sets customer expectations | Managing response SLAs and staffing | Easy measurement, improves perceived responsiveness |
| Customer Satisfaction Score (CSAT) | Low – survey implementation | Low – survey tools & analysis | Direct feedback, identifies satisfaction trends | Customer-centric quality assessment | Provides voice of customer, benchmarks service quality |
| Average Resolution Time | Medium – tracking across workflows | Moderate – requires process automation | Efficiency insights, bottleneck identification | Measuring end-to-end issue handling | Supports SLA, resource planning, process improvements |
| Ticket Volume | Low – counting tickets | Low – data collection systems | Demand trends, capacity planning | Workforce management and trend analysis | Simple, foundational KPI |
| Escalation Rate | Medium – tracking escalations | Moderate – training and tracking tools | Identifies training needs, optimizes support tiers | Improving first-level support effectiveness | Cost optimization, improves customer experience |
| Cost Per Ticket | High – complex cost calculations | High – financial data & analysis | Financial efficiency insights, ROI on improvements | Budgeting and cost management | Clear financial visibility, supports investment decisions |
| Agent Utilization Rate | Medium – time tracking and analysis | Moderate – workforce monitoring tools | Workforce optimization, identifies inefficiencies | Staffing and productivity balancing | Enables data-driven decisions, balances workload |
Turn Your KPIs into a Unified Strategy
Tracking individual help desk KPIs is a crucial first step, but the true power of this data is unlocked when you weave it into a cohesive, unified strategy. We have explored a curated list of essential metrics, from the customer-centric focus of First Call Resolution (FCR) and Customer Satisfaction (CSAT) scores to the operational efficiency measured by Average Resolution Time and Agent Utilization. Each metric offers a unique window into your help desk’s performance, but viewing them in isolation can lead to skewed priorities and missed opportunities.
For instance, focusing solely on reducing Average Resolution Time might inadvertently harm your FCR rate if agents rush to close tickets without fully resolving the underlying issue. Similarly, an obsessive drive to lower the Cost Per Ticket could lead to understaffing, which in turn inflates response times and plummets customer satisfaction. The goal is not just to improve individual numbers but to create a balanced ecosystem where operational efficiency and exceptional customer experience support each other.
From Data Points to Strategic Insights
Transforming raw data into actionable strategy requires a shift in perspective. Instead of seeing these metrics as simple performance grades, view them as diagnostic tools that reveal the health of your entire support operation.
- Connect the Dots: Regularly analyze how your KPIs influence one another. When you launch a new initiative to improve one metric, monitor the impact on others. For example, if you implement a new knowledge base to boost FCR, also track its effect on Average Resolution Time and Ticket Volume.
- Establish a Baseline: Before you can improve, you must know where you stand. Use the benchmarks discussed for each help desk KPI to establish your initial baseline. This provides a concrete starting point for setting realistic goals and measuring progress over time.
- Integrate Your Tools: The disconnect between your customer-facing teams in HubSpot and your development teams in Jira is a common source of inefficiency and data silos. Integrating these platforms is a non-negotiable step for creating a unified view of the customer journey, from initial support ticket to final bug fix. This synergy ensures that customer feedback directly informs product development and that support agents have full visibility into issue status.
Your Next Steps for KPI Mastery
Mastering your help desk KPIs is an ongoing journey of refinement, not a one-time project. Begin by selecting three to four key metrics from this list that align most closely with your current business objectives. Implement a robust tracking system, establish your baseline, and set incremental improvement goals.
Most importantly, foster a data-driven culture where these numbers are not used to punish but to empower. When your team understands the “why” behind each help desk KPI, they become active participants in a shared mission: to deliver outstanding service that drives customer loyalty and fuels business growth. This strategic, holistic approach turns your help desk from a cost center into a powerful engine for value creation.
Ready to break down the silos between your support and development teams? Unify your HubSpot and Jira data with the powerful integration from resolution Reichert Network Solutions GmbH. This tool provides the seamless, bidirectional data flow needed to accurately track your help desk KPIs across the entire customer lifecycle and turn valuable insights into action. Learn more and get started today.
