

Why Your Support Team Needs a Data-Driven Compass
Your support team operates at the critical intersection of customer experience and product reality. Without clear data, you’re navigating blind, relying on gut feelings to gauge performance, allocate resources, and identify friction points. This is where a focused approach to help desk metrics becomes your team’s essential compass, transforming raw operational data into actionable strategic insights. Guesswork leads to agent burnout, frustrated customers, and missed opportunities for product improvement.
This article cuts through the noise to provide a definitive guide to the eight most impactful help desk metrics every support, product, and operations leader should track. We will move beyond simple definitions and provide a comprehensive framework for each metric, covering:
- Precise calculation formulas so you can measure accurately.
- Actionable best practices for tangible improvement.
- Practical tips for tracking these metrics by syncing customer data from HubSpot with technical issues in Jira.
By the end of this list, you’ll have a clear roadmap for creating a data-driven support engine that not only resolves issues efficiently but also fuels customer satisfaction and drives meaningful product evolution. Let’s dive in.
1. First Call Resolution (FCR)
First Call Resolution, often abbreviated as FCR, is a cornerstone of effective customer support and one of the most critical help desk metrics you can track. It measures the percentage of customer service tickets or inquiries that are completely resolved during the very first interaction. This means the customer doesn’t need to call back, send a follow-up email, or have their issue escalated to another team member.
A high FCR rate is a powerful indicator of both operational efficiency and customer satisfaction. When agents can resolve issues promptly, it reduces the overall ticket volume and frees up resources. For the customer, it means a fast, frictionless experience that builds trust and loyalty in your brand. Companies known for stellar service, like Apple and Zappos, prioritize FCR by empowering their agents with extensive training and access to comprehensive knowledge bases.
How to Calculate and Improve FCR
Calculating FCR is straightforward. You divide the number of issues resolved on the first contact by the total number of issues received within a specific period, then multiply by 100 to get a percentage.
To give you a clearer picture, this summary box breaks down the essential data points for First Call Resolution.
As the data shows, a good FCR rate often lands between 70-75%, but this can vary based on the technical complexity of the inquiries your team handles. Improving this metric requires a strategic approach:
- Invest in Agent Resources: Equip your team with a robust internal knowledge base, detailed product documentation, and continuous training. When agents have answers at their fingertips, they can solve problems faster.
- Empower Your Team: Grant agents the authority to make decisions, such as issuing a refund or applying a credit, without needing manager approval. This autonomy eliminates delays and resolves issues on the spot.
- Implement Quality Assurance: Regularly review tickets to ensure that “resolved” issues are genuinely solved. Use follow-up surveys to ask customers directly if their problem was fixed to their satisfaction, providing an essential layer of validation.
For a deeper dive into what FCR means for your team’s performance, the following video offers valuable insights.
2. Average Response Time
Average Response Time is a fundamental metric that measures the speed at which your support team initiates contact with a customer after they submit a ticket or inquiry. Unlike resolution time, which focuses on the total time to solve a problem, this metric zeroes in on the crucial first reply. It’s one of the most visible help desk metrics to your customers, directly shaping their perception of your service’s responsiveness and efficiency.
A low average response time demonstrates that you value your customers’ time and are attentive to their needs. This initial speed can de-escalate frustration and set a positive tone for the entire support interaction. Leading companies set clear benchmarks; for instance, Salesforce aims for a two-hour average response time for its premium support tiers, while Shopify targets a 12-hour response for standard tickets, showing how goals can vary based on service level agreements.
How to Calculate and Improve Average Response Time
You can calculate this metric by summing up all the first response times for a given period and dividing by the total number of tickets that received a first response in that same period. The result is the average time it takes an agent to reply.
Improving this key performance indicator involves a mix of automation, strategic resource allocation, and clear internal processes:
- Set Channel-Specific Targets: Response time expectations vary significantly between channels. A live chat response should be near-instantaneous (under 2 minutes), while an email response might be acceptable within a few hours. Set distinct goals for each channel to reflect user expectations.
- Use Automated Acknowledgments: Implement automated replies to confirm that a ticket has been received. This simple step manages customer expectations, assures them their request is in the queue, and provides an estimated response window.
- Implement Escalation Procedures: Create clear rules that automatically escalate or flag tickets that have aged past your target response time. This ensures no customer inquiry gets lost or forgotten, especially during high-volume periods.
- Consider Time Zone Differences: For global support teams, it’s crucial to account for different time zones. Staffing according to customer location or using a “follow-the-sun” support model ensures that response times remain consistent for all users, regardless of where they are.
3. Customer Satisfaction Score (CSAT)
Customer Satisfaction Score, universally known as CSAT, is one of the most direct help desk metrics for gauging customer happiness. It measures how satisfied customers are with a specific interaction, service, or product. This feedback is typically collected through a simple, one-question survey sent immediately after a support ticket is closed, asking customers to rate their satisfaction on a scale (e.g., 1-5, from “Very Unsatisfied” to “Very Satisfied”).
A high CSAT score is a strong signal that your support team is meeting, or exceeding, customer expectations. It provides a real-time pulse on service quality from the customer’s point of view. Industry leaders like Amazon, which consistently maintains a CSAT of over 95%, use this feedback to reinforce a customer-centric culture. Similarly, Southwest Airlines leverages CSAT data to keep service quality high, achieving scores around 85% even with a high volume of passenger interactions.
How to Calculate and Improve CSAT
Calculating CSAT is straightforward. You take the number of “satisfied” customers (those who gave a positive rating, like 4 or 5 on a 5-point scale) and divide it by the total number of survey responses. Multiply the result by 100 to get a percentage.
Improving this crucial metric requires a proactive and responsive approach to customer feedback:
- Keep Surveys Short and Timely: Send a simple, focused survey immediately after the interaction concludes. The longer you wait, the less accurate the feedback will be.
- Include Open-Ended Questions: While a score is useful, qualitative feedback is gold. Ask “Why did you give this rating?” to uncover specific pain points or highlight what your team is doing well. For practical examples and strategies to craft effective surveys for this metric, explore these key CSAT survey questions.
- Follow Up on Negative Feedback: Create a workflow to immediately address poor scores. A prompt follow-up can turn a negative experience into a positive one and demonstrates that you value customer opinions. To align your support and development teams on these issues, you can implement some of the strategies from these help desk best practices.
4. Average Resolution Time
Average Resolution Time, also known as Mean Time to Resolution (MTTR), is a vital indicator of your support team’s overall efficiency. Unlike FCR, which focuses on the first contact, this metric measures the total time elapsed from when a customer first reports an issue until it is fully resolved and closed. It provides a comprehensive view of the entire support ticket lifecycle, highlighting your team’s capacity to handle issues from start to finish.
A low Average Resolution Time signals an agile and effective support process, directly impacting customer satisfaction. When issues are resolved swiftly, it minimizes customer frustration and demonstrates your commitment to their success. Tech leaders like Atlassian strive to maintain a 2-day average for standard issues, while Dropbox aims for a 1-day resolution for account-related tickets, showcasing how this metric is a key performance benchmark for top-tier companies. Tracking this is one of the most important help desk metrics for understanding team workload and process bottlenecks.
How to Calculate and Improve Average Resolution Time
Calculating Average Resolution Time is done by summing the total resolution time for all tickets in a given period and dividing it by the number of tickets resolved in that same period.
To give you a clearer picture, this summary box breaks down the essential data points for Average Resolution Time.
To improve this crucial metric, focus on streamlining your internal processes and empowering your agents. The goal is to remove any friction that prolongs the ticket lifecycle:
- Exclude Customer Pending Time: For a more accurate measure of agent efficiency, pause the clock when you are waiting for a customer response. This ensures your metrics reflect the time your team is actively working on the issue.
- Set Tiered Resolution Targets: Not all tickets are created equal. Establish different resolution time goals based on issue priority and complexity. A critical system-down bug should have a much shorter target than a low-priority feature request.
- Implement Escalation Procedures: Define clear, automated rules for escalating tickets that are approaching their resolution deadline. This ensures aging tickets get the attention they need from senior staff or other departments before they negatively impact the customer experience.
- Review Outliers Regularly: Analyze tickets that take significantly longer than average to resolve. These outliers often reveal hidden process inefficiencies, knowledge gaps, or recurring product issues that need to be addressed at a systemic level.
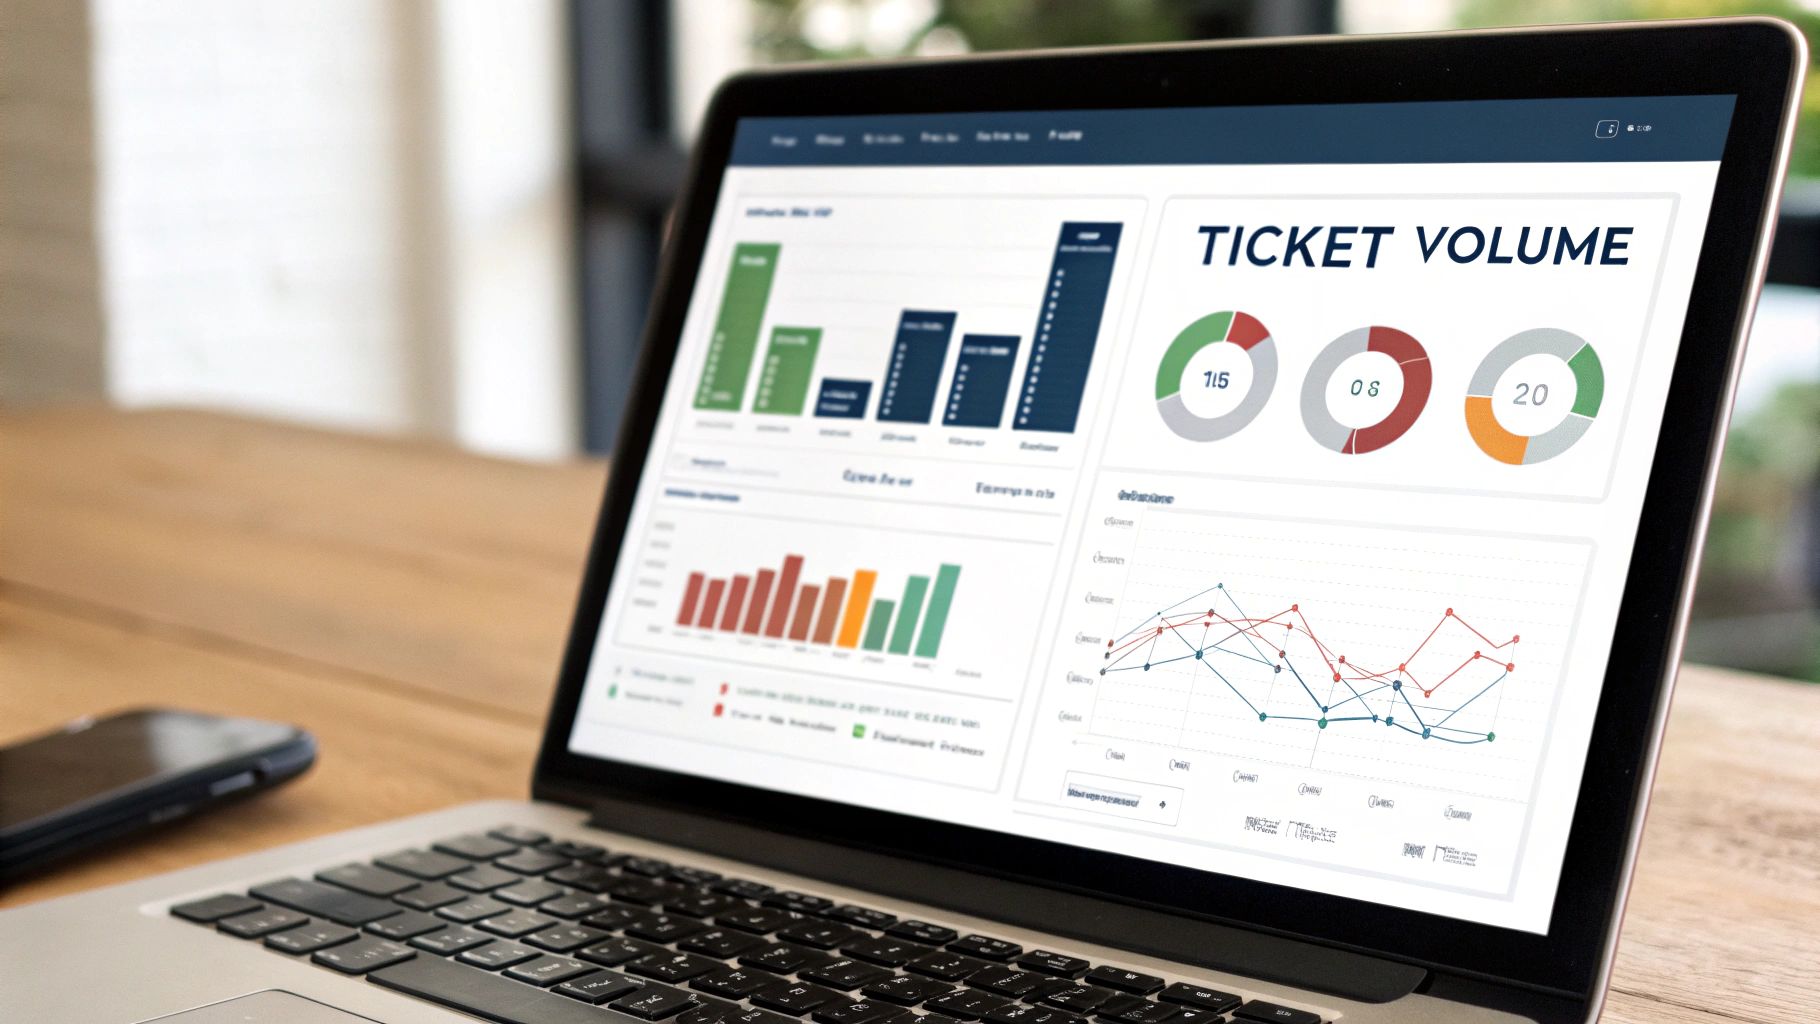
5. Ticket Volume
Ticket Volume is a fundamental metric that tracks the total number of support requests your help desk receives over a specific time period, such as a day, week, or month. As one of the most straightforward help desk metrics, it provides a direct measure of your support team’s workload and the overall demand for customer service. Monitoring this metric is crucial for resource allocation, capacity planning, and identifying emerging trends that could impact your operations.
A sudden spike in ticket volume, for instance, might indicate a product bug, a service outage, or the impact of a new feature launch. Major service providers are acutely aware of these patterns. For example, a streaming giant like Netflix might see a 40% increase in volume after launching a popular new series, while a rideshare company like Uber could experience a 300% spike during a temporary service outage. Tracking this data allows businesses to anticipate needs and scale their support efforts accordingly.
How to Calculate and Manage Ticket Volume
Calculating ticket volume is as simple as counting the total number of new tickets created within your chosen timeframe. While the calculation is easy, the real value comes from analyzing and managing the trends this data reveals. A proactive approach is essential for maintaining service quality without overwhelming your team.
For instance, the HubSpot for Jira integration allows teams to automatically create Jira issues from HubSpot tickets. By syncing these platforms, you can track volume in HubSpot while seamlessly escalating engineering-related issues to Jira, ensuring that support volume data informs your product development roadmap. Managing this metric effectively involves several key strategies:
- Track Volume Trends: Monitor ticket volume over time to identify daily, weekly, and seasonal patterns. This historical data is invaluable for predicting future needs and scheduling agent shifts, especially during anticipated peak periods.
- Analyze Volume by Category: Don’t just track the total number. Segment your ticket volume by product, feature, or issue type. This helps pinpoint recurring problems that might be solved with a product update, a new knowledge base article, or better user onboarding.
- Implement Self-Service Options: A high volume of tickets for simple, repetitive questions is a clear sign that you need better self-service resources. Developing a comprehensive FAQ page, a knowledge base, or chatbots can deflect a significant portion of incoming requests, freeing up agents to handle more complex issues.
- Use Data for Capacity Planning: Use your volume data to make informed decisions about staffing. If you consistently see volume increasing month-over-month, it’s a clear indicator that you may need to hire more support agents to maintain response times and service quality.
6. Agent Utilization Rate
Agent Utilization Rate is one of the most practical help desk metrics for understanding team productivity and managing operational costs. It measures the percentage of an agent’s logged-in time that is spent on support-related activities, such as handling calls, responding to emails, or working on tickets, compared to their total available time. This metric is crucial for optimizing staffing levels, ensuring you have enough coverage without overstaffing, and identifying opportunities for greater efficiency.
A healthy utilization rate directly impacts your bottom line and your team’s well-being. Aiming for 100% utilization is a recipe for burnout, as it leaves no room for breaks, training, or administrative tasks. Leading service platforms like Zendesk and ServiceNow often recommend a target between 70% and 80% to maintain a balance between high performance and employee sustainability. This strategic buffer ensures agents can recharge and participate in skill development, ultimately leading to higher-quality service.
How to Calculate and Improve Agent Utilization Rate
To calculate Agent Utilization Rate, you take the total time an agent spends on support-related activities, divide it by their total logged-in time for a given period, and then multiply by 100. For instance, if an agent is logged in for 8 hours (480 minutes) and spends 6 hours (360 minutes) on active tasks, their utilization rate is 75%.
Effective workload management is key to optimizing this metric. As detailed in these workload management strategies from Resolution, balancing assignments prevents burnout and maintains quality. To improve your utilization rate without overwhelming your team, consider these actionable steps:
- Balance with Quality: Never track utilization in isolation. Monitor it alongside metrics like Customer Satisfaction (CSAT) and First Call Resolution (FCR) to ensure that increased productivity doesn’t come at the expense of service quality.
- Account for All Work: Ensure your calculation includes all productive activities, not just direct customer interaction. Time spent on training, team meetings, and updating knowledge base articles is valuable and should be factored into “utilized” time.
- Monitor Individual Trends: Look for significant variations in utilization rates among agents. A consistently low rate might indicate a need for more training or engagement, while a perpetually high rate could signal an agent is at risk of burnout and may need their workload adjusted.
- Optimize Your Tools: Integrating systems like HubSpot and Jira can significantly reduce the time agents spend on administrative tasks like manual data entry. Automating ticket creation and syncing data between your CRM and issue tracker frees up agents to focus on what they do best: solving customer problems.
7. Escalation Rate
Escalation Rate is one of the most revealing help desk metrics, tracking the percentage of support tickets that cannot be resolved by first-level agents and must be passed on to a higher support tier, a specialized team, or management. A ticket is escalated when the initial agent lacks the knowledge, authority, or tools to solve the customer’s problem effectively. This metric is a crucial indicator of front-line team capabilities and the efficiency of your support processes.
A high escalation rate can signal gaps in training, insufficient agent empowerment, or overly complex products that require specialized knowledge. Monitoring this metric helps identify areas for improvement. For instance, major tech companies like Microsoft and Cisco closely track this figure to balance front-line efficiency with expert support, aiming for rates between 15-25% depending on the product’s technical complexity. A well-managed escalation process ensures that while simple issues are handled quickly, complex problems are routed to the right experts without delay.
How to Calculate and Improve Escalation Rate
Calculating the Escalation Rate is straightforward. You divide the total number of escalated tickets by the total number of tickets received within the same period, then multiply by 100 to get a percentage. This calculation gives a clear view of how many customer issues require advanced intervention. For teams managing this process between different platforms, syncing data is key. You can learn more about how a HubSpot and Jira ticket escalation process works and how an integration can streamline it.
To give you a clearer picture, this summary box breaks down the essential data points for Escalation Rate.
As the data suggests, a healthy escalation rate often falls below 25%, though this benchmark depends heavily on your industry and service complexity. Reducing unnecessary escalations requires a targeted strategy:
- Define Clear Escalation Pathways: Create and document precise criteria for when a ticket should be escalated. This prevents agents from escalating issues prematurely or holding onto tickets for too long.
- Track Escalation Reasons: Categorize why tickets are being escalated. This data is invaluable for identifying specific knowledge gaps in your first-level team or recurring product issues that need to be addressed by development.
- Provide Continuous Training: Use the data from escalation tracking to inform your training programs. If many tickets are escalated due to a specific technical feature, dedicate training sessions to that topic to empower front-line agents.
- Distinguish Between Appropriate and Inappropriate Escalations: Not all escalations are bad. It’s vital to differentiate between necessary escalations for complex issues and those that happen due to a lack of resources or training on the front line.
8. Cost Per Ticket
Cost Per Ticket is a critical financial metric that reveals the total expense associated with resolving a single customer support inquiry. This isn’t just about agent salaries; it’s a comprehensive calculation that includes all labor, technology, and overhead costs. Understanding this figure is essential for any organization aiming to optimize its support operations, making it one of the most important help desk metrics for financial planning and efficiency analysis.
A low Cost Per Ticket can signify a highly efficient support process, but it must be balanced with quality. Aggressively cutting costs can lead to a drop in customer satisfaction. The goal is to find the sweet spot where efficiency meets effectiveness. For instance, Gartner reports that the average cost per ticket can range widely from $15 to $50 depending on the support channel and issue complexity. This highlights how channel strategy, like promoting self-service, can drastically impact operational expenses. Phone support might cost $25-40 per ticket, while a self-service resolution can cost as little as $0.10.
How to Calculate and Improve Cost Per Ticket
To calculate your Cost Per Ticket, you sum all your monthly help desk operating costs (salaries, software licenses, office space, etc.) and divide that total by the number of tickets resolved in the same month.
This summary provides a clearer view of the components and goals for managing Cost Per Ticket.
As the data implies, reducing this cost without sacrificing quality is a key objective. A strategic approach is necessary to achieve this balance:
- Analyze Costs Across Channels: Compare the Cost Per Ticket for different support channels like email, phone, chat, and self-service. This data can justify shifting volume to more cost-effective channels, like a knowledge base or community forum.
- Invest in Automation and Self-Service: Use your cost data to build a business case for tools that enable automation and self-service. Investing in a robust knowledge base or an AI-powered chatbot can deflect tickets and lower overall costs dramatically.
- Maintain Quality in Parallel: As you implement cost-saving measures, continuously monitor quality metrics like Customer Satisfaction (CSAT) and First Call Resolution (FCR). This ensures your efficiency gains don’t come at the expense of the customer experience.
The following video explores strategies for managing support costs effectively, offering deeper insights into this crucial metric.
Key Help Desk Metrics Comparison
| Metric | Implementation Complexity 🔄 | Resource Requirements ⚡ | Expected Outcomes 📊 | Ideal Use Cases 💡 | Key Advantages ⭐ |
|---|---|---|---|---|---|
| First Call Resolution (FCR) | Medium complexity; requires clear resolution definitions and multi-channel tracking | High: training, QA, knowledge bases | Higher customer satisfaction, reduced repeat contacts | Customer support aiming to improve loyalty & reduce operational costs | Strong link to satisfaction; reduces costs; indicates agent/system effectiveness |
| Average Response Time | Low complexity; time tracking across channels | Moderate: monitoring tools and SLA management | Faster response, improved customer perception | Service level monitoring, staffing optimization | Easy to measure; directly impacts customer perception |
| Customer Satisfaction Score (CSAT) | Low complexity; survey integration and data collection | Moderate: survey tools and feedback analysis | Direct feedback on service quality | Service quality evaluation and improvement | Direct customer feedback; easy for customers; actionable insights |
| Average Resolution Time | Medium complexity; requires full lifecycle tracking | Moderate to high: tracking tools and escalation management | Comprehensive efficiency measure; process bottleneck ID | SLA compliance, capacity planning | Holistic efficiency metric; critical for SLA compliance |
| Ticket Volume | Low complexity; simple counting and segmentation | Low to moderate: reporting dashboards | Trend analysis, capacity planning | Staffing, demand forecasting | Essential for forecasting and resource planning |
| Agent Utilization Rate | Medium complexity; time usage tracking excluding breaks | Moderate: time tracking tools | Optimized staffing, productivity insights | Workforce management | Identifies underutilization; aids performance management |
| Escalation Rate | Medium complexity; escalation tracking and categorization | Moderate: multi-level tracking | Highlights training gaps, process effectiveness | Support tier optimization | Identifies knowledge gaps; cost management |
| Cost Per Ticket | High complexity; detailed cost allocation | High: financial data collection and analysis | Understanding support costs, ROI analysis | Budgeting, cost optimization | Enables cost-benefit analysis; supports automation business cases |
Turn Metrics into Momentum
You’ve explored the essential landscape of help desk metrics, moving from individual data points to a holistic understanding of your support ecosystem. We’ve dissected everything from the immediate impact of First Call Resolution (FCR) and Average Response Time to the long-term strategic value of Customer Satisfaction (CSAT) and Agent Utilization. The key takeaway is clear: these numbers are far more than just performance indicators; they are the narrative of your customer experience and the blueprint for operational excellence.
Merely tracking these figures is not the endgame. The true power of help desk metrics is unleashed when you transform them from static reports into dynamic catalysts for change. Each metric tells a story. A rising Escalation Rate might signal a need for better agent training or more robust knowledge base articles. A high Cost Per Ticket could point to inefficient workflows that a tool like the HubSpot for Jira integration is specifically designed to streamline, connecting customer data directly to developer queues.
From Data to Actionable Strategy
To truly turn these metrics into momentum, you must foster a culture of data-driven decision-making. This means going beyond monthly reviews and integrating these insights into your daily operations.
- Connect the Dots: Don’t analyze metrics in isolation. A low FCR often correlates with a high Average Resolution Time and a low CSAT score. By understanding these relationships, you can identify the root cause of an issue, not just its symptoms. For instance, if all three are trending poorly, the problem might not be agent performance but a recurring product bug that needs to be escalated to your engineering team in Jira.
- Empower Your Team: Share performance data transparently with your agents. Frame it not as a tool for scrutiny, but as a map for professional growth. When an agent understands how their work on a ticket directly impacts metrics like CSAT and FCR, they are more empowered to take ownership and improve their approach.
- Automate and Integrate: The manual effort of toggling between systems is a major drain on efficiency and a source of data discrepancies. This is where bridging the gap between your CRM (like HubSpot) and your issue tracker (like Jira) becomes critical. Automating ticket creation and syncing data ensures your metrics are accurate and your teams can focus on problem-solving, not administrative overhead.
Mastering your help desk metrics is about building a smarter, more responsive, and more efficient support operation. It’s about proactively identifying friction points before they become major problems and ensuring your support team has the tools and insights needed to deliver exceptional service. This strategic approach doesn’t just improve the support department; it strengthens customer loyalty, informs product development, and ultimately drives business growth.
Ready to bridge the data gap between your support and development teams for unparalleled metric accuracy? The HubSpot for Jira integration by resolution Reichert Network Solutions GmbH provides a seamless, two-way data sync that enriches your tickets with crucial customer context. Start turning your metrics into actionable momentum and build a more connected workflow today.
Explore the HubSpot for Jira Integration by resolution Reichert Network Solutions GmbH
