

In today’s fast-paced business environment, a reactive IT support team is no longer enough. The difference between a good and a great IT department lies in the data. By tracking the right it support metrics, you can transform your team from a simple help desk into a strategic business asset that drives efficiency, improves user satisfaction, and proactively prevents issues before they disrupt workflow. This isn’t just about counting closed tickets; it’s about understanding the health and impact of your entire support operation.
This comprehensive guide moves beyond basic troubleshooting to explore the eight most critical metrics that every IT leader, project manager, and service agent should monitor. We will provide a detailed breakdown for each performance indicator, covering:
- Clear definitions to ensure you’re measuring the right thing.
- Practical methods for accurate measurement within your systems.
- Industry benchmarks to see how you stack up.
- Actionable strategies to improve your performance and demonstrate value.
Get ready to move beyond just closing tickets and start delivering real, measurable results with a data-driven approach to IT support.
1. First Call Resolution (FCR)
First Call Resolution (FCR) is one of the most vital IT support metrics, gauging the percentage of user issues resolved during the very first interaction. A high FCR rate signifies an efficient, knowledgeable, and well-equipped support team that can diagnose and solve problems without needing escalations or follow-up contacts. This not only boosts customer satisfaction by providing swift resolutions but also enhances operational efficiency by freeing up agent time.
When an employee’s software issue is fixed on the first call, they can immediately return to productive work, minimizing downtime. This metric directly reflects the effectiveness of your front-line support structure and its ability to handle a wide range of common problems.
Why FCR Matters and How to Improve It
Achieving a high FCR is a powerful indicator of a mature IT support process. For example, Cisco’s internal IT support famously improved its FCR from 60% to 78% by integrating AI-powered diagnostic tools that guided agents to faster solutions. Similarly, IBM’s help desk saw its FCR climb to 82% after developing role-specific troubleshooting guides.
This bar chart compares a team’s FCR rate against industry benchmarks, providing a clear visual of performance.
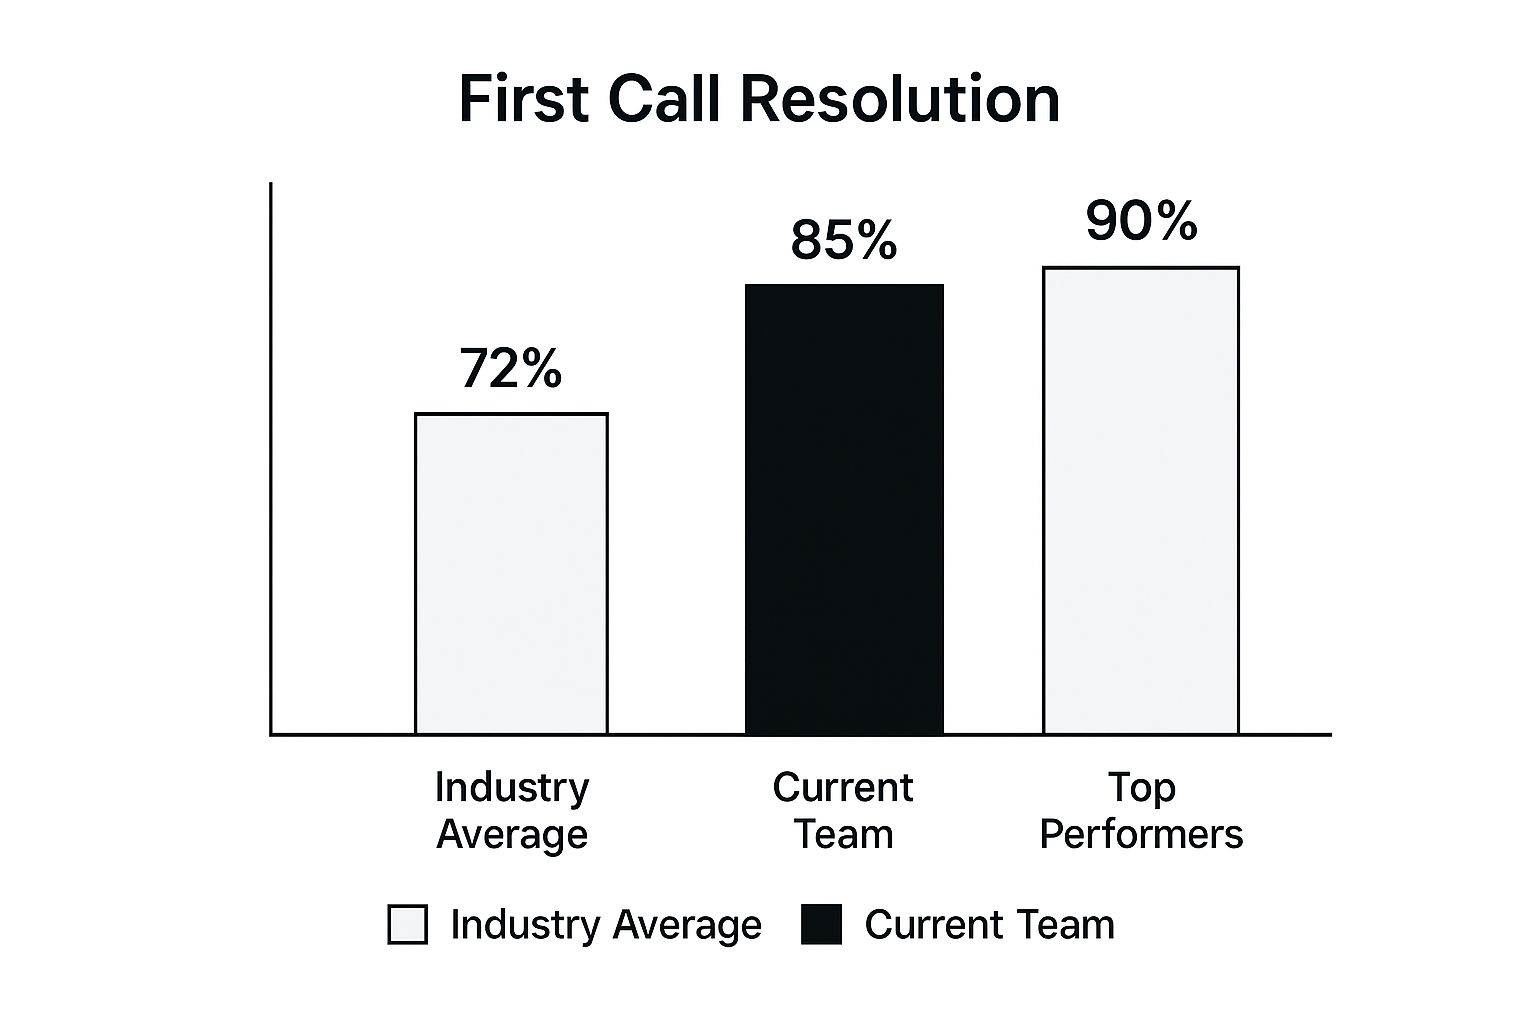
The chart illustrates that while an 85% FCR is well above the industry average, there is still a gap to reach the top-tier performance level of 90%.
To elevate your team’s FCR, consider these actionable steps:
- Invest in Knowledge Management: Develop and maintain a comprehensive, easily searchable knowledge base. Empower agents with the information they need at their fingertips.
- Implement Intelligent Routing: Use skills-based routing to ensure incoming tickets are immediately directed to the agent or group with the most relevant expertise.
- Analyze Failures: Regularly review tickets that were not resolved on the first contact. Identify patterns, knowledge gaps, or process inefficiencies to target for improvement.
- Balance Speed and Quality: Avoid pressuring agents to close tickets prematurely. An unresolved issue marked as “resolved” is worse than an honest escalation, as it erodes user trust.
2. Mean Time to Resolution (MTTR)
Mean Time to Resolution (MTTR) is a critical component among IT support metrics, measuring the average total time from when a support ticket is first created until it is fully resolved and closed. This end-to-end metric provides a holistic view of the support lifecycle, highlighting overall process efficiency and helping to manage user expectations. A low MTTR indicates that your support team can swiftly diagnose, address, and close issues, minimizing user disruption and business impact.
Tracking MTTR is essential for understanding the entire support journey. It reveals bottlenecks that may occur after the initial response, such as delays in escalation, parts procurement, or collaboration between teams. By monitoring this metric, organizations can pinpoint and rectify inefficiencies in their resolution workflow.

Why MTTR Matters and How to Improve It
A low MTTR directly correlates with high user satisfaction and reduced operational costs. For instance, Google’s internal IT support maintains an MTTR of under one hour for critical issues by leveraging extensive automation. Similarly, Atlassian improved its MTTR by an impressive 40% after implementing automated ticket routing and expanding its self-service options, demonstrating the power of process optimization. Tracking this operational performance indicator is key to achieving such results.
This video provides a deeper dive into the nuances of MTTR and other related metrics.
To significantly lower your team’s MTTR, focus on these targeted strategies:
- Track MTTR by Severity: Segment your MTTR tracking based on issue priority and complexity. High-priority incidents should have a much lower target MTTR than routine requests. This allows for more accurate performance analysis and resource allocation.
- Implement Automated Routing: Use your IT service management (ITSM) platform to automatically route incoming tickets to the correct team or agent. This eliminates manual triage delays, which are often a major contributor to high MTTR.
- Create Detailed Runbooks: Develop step-by-step resolution guides (runbooks) for common and recurring issues. This empowers all agents, especially junior ones, to resolve problems faster without needing to escalate.
- Invest in Proactive Monitoring: Utilize monitoring tools that can detect potential issues before they impact users. Proactive problem management can prevent tickets from being created in the first place, which is the ultimate MTTR reduction. You can master operational performance indicators on Resolution.de to further refine this process.
3. Customer Satisfaction Score (CSAT)
Customer Satisfaction Score (CSAT) is one of the most direct IT support metrics, capturing how satisfied users are with the support they received. It is typically collected via simple, post-interaction surveys where users rate their experience on a scale (e.g., 1-5, Very Unsatisfied to Very Satisfied). A high CSAT score indicates that the support team is not just closing tickets but is also meeting or exceeding user expectations in terms of helpfulness, professionalism, and timeliness.
This metric provides invaluable qualitative insight directly from the end-user, highlighting the human element of IT support. When an employee feels heard and well-supported, it significantly improves their overall perception of the IT department and the company, fostering a more positive and productive work environment.
Why CSAT Matters and How to Improve It
A high CSAT is a hallmark of a user-centric IT support operation. For instance, Amazon’s internal IT support consistently maintains CSAT scores above 90% by focusing on personalized service and proactive communication. Similarly, Salesforce achieved an 88% CSAT by implementing real-time feedback collection and establishing a rapid-response protocol for any negative feedback received.
This image shows a typical CSAT survey, a simple yet powerful tool for gathering user feedback.

The simplicity of the survey encourages higher response rates, providing a continuous stream of actionable data.
To boost your team’s CSAT, consider these actionable steps:
- Keep Surveys Short and Focused: Design brief, one-or-two-question surveys that are easy for users to complete. Ask specifically about the recent interaction to get relevant feedback.
- Follow Up on Negative Feedback: Actively engage with dissatisfied users. This not only helps you understand the root cause of the issue but also shows users that their opinion is valued, often turning a negative experience into a positive one.
- Train for Soft Skills: Technical expertise is crucial, but so are communication, empathy, and patience. Invest in soft skills training to ensure agents deliver a positive and professional user experience.
- Segment CSAT Data: Analyze CSAT scores by agent, team, ticket type, or channel. This segmentation helps pinpoint specific areas, processes, or individuals that may require targeted improvement efforts.
4. Ticket Volume and Trends
Ticket Volume and Trends tracks the number of support requests received over specific time periods and analyzes patterns, seasonal variations, and growth. This is one of the foundational IT support metrics, essential for strategic planning and resource allocation. A clear understanding of ticket volume helps teams anticipate demand, justify staffing levels, and identify systemic issues before they escalate.
By monitoring these trends, IT leaders can move from a reactive to a proactive support model. For example, a sudden spike in tickets related to a specific application after an update indicates a flawed release, allowing for a swift rollback or patch. This metric provides the data needed to manage resources effectively and maintain service stability.
Why Ticket Volume Matters and How to Improve It
Analyzing ticket volume trends is crucial for operational health and proactive problem management. For example, Dropbox implemented proactive system monitoring that directly led to a 25% reduction in reactive ticket volume. Similarly, Spotify’s IT team uses trend analysis to accurately predict and prepare for support surges during major product launches, ensuring a smooth user experience.
This approach transforms raw ticket counts into actionable intelligence, enabling teams to address root causes instead of just symptoms. By correlating ticket data with business events, you can pinpoint the exact drivers of support demand. For more information, you can explore key service desk performance indicators on resolution.de.
To better manage and influence your ticket volume, consider these actionable steps:
- Implement Trending Analysis: Use your ITSM tool to regularly identify growing issue categories. If password reset requests are climbing, it may be time to invest in a self-service solution.
- Correlate Spikes with Events: Connect sudden increases in ticket volume to recent system changes, software deployments, or external events like phishing campaigns. This helps identify direct cause-and-effect relationships.
- Segment Volume by Department: Break down ticket data by business unit, location, or user role. This can reveal that a specific department needs targeted training or that a particular office is experiencing unique hardware failures.
- Justify Proactive Investments: Use sustained high-volume data for a specific issue to build a business case for a permanent fix, such as upgrading aging infrastructure or replacing a problematic software platform.
5. Service Level Agreement (SLA) Compliance
Service Level Agreement (SLA) Compliance is a cornerstone among IT support metrics, measuring the percentage of support tickets resolved within the timeframes promised in formal service agreements. A high SLA compliance rate demonstrates reliability and a commitment to service quality, which is crucial for building and maintaining user trust. This metric holds the support team accountable to agreed-upon standards, ensuring consistent service delivery.
When IT support consistently meets its SLAs, the entire organization benefits from predictable and dependable service. This stability allows business units to plan their work effectively, knowing that IT issues will be addressed within a specified window, thus minimizing disruptions and upholding operational integrity.
Why SLA Compliance Matters and How to Improve It
Meeting or exceeding SLA targets is a direct reflection of a well-managed IT support operation. For instance, IBM’s Global Technology Services maintains an impressive 98% SLA compliance by leveraging automated monitoring and clear escalation procedures. Similarly, Accenture’s managed IT services achieve a 95% rate through the use of predictive analytics and strategic resource optimization, showcasing how advanced tools can ensure commitments are met.
Achieving high compliance is not just about avoiding penalties; it’s about proving the value and efficiency of the IT department. Even significant improvements are possible, as seen when HP Enterprise Services boosted its SLA compliance from 85% to 96% by standardizing processes and introducing automation.
To improve your team’s SLA compliance, consider these actionable steps:
- Set Realistic SLAs: Define your SLAs based on historical performance data and ticket priority, not just aspirations. Ensure that response and resolution times are achievable and align with business needs.
- Implement Automated Monitoring: Use your IT Service Management (ITSM) tool to automatically track time against SLAs. Configure alerts to notify agents and managers when a ticket is at risk of breaching its deadline.
- Establish Clear Escalation Paths: Create predefined procedures for what happens when a ticket is approaching an SLA breach. This ensures at-risk issues receive immediate attention from senior staff or specialized teams.
- Use Data to Drive Improvement: Regularly analyze SLA performance reports to identify bottlenecks, common points of failure, or areas where teams may need additional training or resources. For more details on this, learn more about Service Level Agreement monitoring.
6. Agent Utilization Rate
Agent Utilization Rate is one of the core IT support metrics used to measure workforce efficiency. It calculates the percentage of an agent’s logged-in time that is dedicated to productive, support-related tasks, such as handling tickets, versus time spent idle or on non-productive activities. This metric is essential for optimizing resource allocation, managing operational costs, and ensuring the team is staffed appropriately to meet demand.
A healthy utilization rate indicates that your support team is engaged and productive without being overworked. It provides valuable insights into team capacity, helping managers make informed decisions about scheduling, hiring, and implementing new tools to automate routine tasks. This ensures you are maximizing the value of your most important asset: your support staff.
Why Agent Utilization Rate Matters and How to Improve It
Balancing utilization is key to maintaining a sustainable and effective support operation. For instance, Dell’s technical support famously optimized its agent utilization to 85% by deploying intelligent call routing and automated diagnostic tools. Similarly, ServiceNow’s internal support team improved agent utilization from 65% to 78% by implementing sophisticated workflow automation and skill-based ticket routing, ensuring agents were always working on tasks best suited to their expertise.
This shows that improving utilization is not about keeping agents busy for the sake of it, but about making their work more impactful and efficient. The goal is to reduce wasted time and administrative overhead, allowing agents to focus on complex problem-solving. Effective workforce management and capacity planning are crucial here, and tools that integrate with service desks like Jira can be particularly helpful. Learn more about Jira capacity planning.
To elevate your team’s Agent Utilization Rate, consider these actionable steps:
- Balance Utilization with Quality: Avoid setting aggressive utilization targets that lead to burnout or a decline in service quality. Monitor this metric alongside customer satisfaction (CSAT) and First Call Resolution (FCR) to ensure a healthy balance.
- Redefine “Productive Time”: Your calculation of productive work should include more than just active ticket handling. Account for valuable activities like updating the knowledge base, undergoing training, and mentoring junior colleagues.
- Identify Improvement Opportunities: Use utilization data to pinpoint inefficiencies. Low utilization might signal a need for better tools or more training, while consistently high utilization might indicate that the team is understaffed.
- Monitor Alongside Other Metrics: Utilization should never be analyzed in a vacuum. A high rate is only positive if quality metrics like CSAT and FCR remain strong, proving that efficiency is not coming at the expense of effective support.
7. System Availability and Uptime
System Availability and Uptime is one of the most fundamental IT support metrics, measuring the percentage of time that IT systems and services are operational and accessible to users. A high uptime percentage indicates robust, reliable infrastructure and proactive management, ensuring that employees can access the tools they need without interruption. This metric is a cornerstone of IT service quality, as downtime directly translates to lost productivity and potential revenue loss.
When business-critical applications are consistently available, it builds trust in the IT department and supports seamless operations across the organization. This metric directly reflects the health of your infrastructure and the effectiveness of your IT operations management.
Why Uptime Matters and How to Improve It
Achieving high availability is a clear signal of a mature IT environment. For instance, Amazon Web Services (AWS) famously designs for high availability, often targeting 99.99% uptime for its services by using redundant infrastructure and automated failover systems. Similarly, Microsoft Azure significantly improved its availability from 99.5% to 99.95% by implementing regional redundancy and intelligent traffic routing to handle disruptions.
This bar chart compares a team’s system uptime against industry standards, highlighting performance against key benchmarks.
The chart shows that while the team’s 99.9% uptime is better than the industry average, there is a clear opportunity to reach the top-tier “four nines” (99.99%) level of availability.
To elevate your system uptime, consider these actionable steps:
- Implement Redundancy: Build resilient systems with redundant components and automated failover capabilities to ensure service continuity during a component failure.
- Use Predictive Monitoring: Invest in monitoring tools that provide real-time visibility and use predictive analytics to identify potential issues before they cause outages.
- Separate Downtime Types: Clearly distinguish between planned maintenance and unplanned downtime in your calculations. This provides a more accurate picture of system reliability versus scheduled service windows.
- Focus on Critical Services: Prioritize monitoring and improvement efforts on the systems and applications that are most critical to business operations.
8. Cost per Ticket
Cost per Ticket is one of the most critical financial IT support metrics, calculating the total operational cost of your support services divided by the number of tickets resolved. A low Cost per Ticket indicates high economic efficiency, showing that the support function is delivering value without overspending. This metric is essential for budget planning, justifying technology investments, and understanding the financial impact of service improvements or degradations.
By tracking this KPI, organizations can pinpoint inefficiencies and make data-driven decisions to optimize resource allocation. It directly connects IT support activities to the company’s bottom line, highlighting how process improvements can translate into significant cost savings.
Why Cost per Ticket Matters and How to Improve It
Lowering the Cost per Ticket without sacrificing quality is a hallmark of a mature, well-managed IT support operation. For instance, IBM successfully reduced its cost per ticket by 35% by implementing AI-powered automation and expanding its self-service options. Similarly, Microsoft cut its internal IT support expenses by 40% through the strategic use of chatbots and intelligent ticket routing, which handled common queries and directed complex issues to the right specialists more efficiently.
This metric helps IT leaders demonstrate the financial prudence of their department and make a strong case for investing in preventative technologies.
To lower your team’s Cost per Ticket, consider these actionable steps:
- Segment by Complexity: Don’t treat all tickets equally. Segment Cost per Ticket by issue type (e.g., password reset vs. server outage) and complexity to get an accurate picture of where your resources are going.
- Include All Costs: For an accurate calculation, factor in all relevant expenses: agent salaries, benefits, technology licensing fees, training programs, and a portion of overhead like facilities and utilities.
- Invest in Self-Service and Automation: Empower users to solve their own problems with a robust knowledge base and automated tools. This reduces the number of tickets requiring direct agent intervention, drastically lowering costs for common issues.
- Focus on Prevention: Use ticket data to identify recurring problems and invest in permanent fixes or preventive maintenance. Solving the root cause is more cost-effective than repeatedly fixing the symptom. Explore additional help desk best practices on resolution.de to further optimize your cost structure.
Key IT Support Metrics Comparison
| Metric | Implementation Complexity 🔄 | Resource Requirements ⚡ | Expected Outcomes 📊 | Ideal Use Cases 💡 | Key Advantages ⭐ |
|---|---|---|---|---|---|
| First Call Resolution (FCR) | Moderate – requires training & tools | Medium – knowledge bases, AI tools | Higher customer satisfaction & reduced repeat calls | Frontline support aiming to improve efficiency | Improves satisfaction, reduces costs, lowers call volume |
| Mean Time to Resolution (MTTR) | Moderate – process tracking & automation | Medium – monitoring & automation tools | Faster resolution times & bottleneck identification | Managing SLA, prioritizing incident response | Identifies bottlenecks, supports SLA management |
| Customer Satisfaction Score (CSAT) | Low – survey implementation | Low – survey tools & analysis | Direct feedback on service quality | Measuring user satisfaction post-service | Provides user insights, benchmarks agent performance |
| Ticket Volume and Trends | Low to Moderate – requires data tracking | Low to Medium – analytics tools | Capacity planning and trend insights | Proactive IT management and resource planning | Detects patterns, supports strategic decisions |
| SLA Compliance | Moderate – monitoring & escalation setup | Medium – automated alert systems | Ensures contract adherence & consistent service delivery | Contractual and service-level management | Sets clear expectations, improves accountability |
| Agent Utilization Rate | Moderate – time tracking & workflow tools | Medium – workforce management systems | Optimized agent workload and capacity planning | Workforce management and performance coaching | Balances workload, identifies training needs |
| System Availability and Uptime | High – infrastructure monitoring | High – continuous monitoring & redundancy | Reliable system access, reduced downtime | Infrastructure and critical system support | Improves business continuity, supports SLA adherence |
| Cost per Ticket | Moderate – cost tracking & allocation | Medium – financial and operational data | Cost efficiency insights and budget optimization | Financial management of support services | Enables cost control, supports ROI and budgeting |
From Metrics to Mastery: Building a Data-Driven Support Culture
Navigating the landscape of IT support without clear metrics is like sailing in a storm without a compass. Throughout this guide, we’ve explored eight critical IT support metrics, from First Call Resolution (FCR) and Mean Time to Resolution (MTTR) to Customer Satisfaction (CSAT) and Service Level Agreement (SLA) Compliance. Each metric offers a unique window into your team’s performance, providing the raw data needed to identify bottlenecks, celebrate successes, and drive continuous improvement.
However, the true value of these metrics is unlocked not when they are viewed in isolation, but when they are woven together into a comprehensive performance narrative. Isolated data points are just numbers; interconnected insights create a story.
The Power of Interconnected Data
Think of your metrics as a diagnostic toolkit. A sudden spike in ticket volume isn’t just a number; it’s a symptom. When you cross-reference it with other metrics, the underlying cause often becomes clear.
- High Ticket Volume + Low FCR? This combination might point to a complex new issue that your team isn’t equipped to handle on the first touch. It could also signal a failure in a recent software update, requiring proactive communication and knowledge base articles.
- Excellent SLA Compliance + Declining CSAT? This is a classic sign that your SLAs are misaligned with genuine user expectations. Your team might be hitting their technical targets, but users feel their issues aren’t being resolved with the urgency or quality they need. It’s a call to re-evaluate what you promise versus what your customers truly value.
- High Agent Utilization + High Cost Per Ticket? This could indicate that your agents are busy but inefficient. They might be spending too much time on simple, repetitive tasks that could be automated or deflected through better self-service portals, preventing them from focusing on high-impact problems.
Turning Insights into Actionable Strategy
Mastering your IT support metrics is about moving from passive monitoring to active, strategic management. The goal is to build a resilient, data-driven culture where every decision is informed by clear, quantifiable evidence. A crucial component of this resilience is maintaining operational continuity, especially when key team members are unavailable. Unexpected absences or planned vacations can easily derail your MTTR and compromise SLA compliance, skewing your metrics and frustrating users.
This is where intelligent automation becomes a strategic asset. Tools that manage agent availability and automatically delegate tasks ensure that no ticket falls through the cracks. By protecting your workflows from disruption, you safeguard the integrity of your performance data. This allows you to trust the story your metrics are telling and build a support organization that is not only efficient and responsive but also consistently reliable. Ultimately, this data-driven mastery transforms IT support from a cost center into a strategic business partner, valued for its direct contribution to organizational productivity and employee satisfaction.
Ready to protect your SLA compliance and keep your support metrics stable, even when team members are out of the office? Explore the Out of Office Assistant for Jira Cloud from resolution Reichert Network Solutions GmbH to automate issue reassignment and ensure seamless workflow continuity. Learn more here.
