

In the fast-paced world of IT support, simply handling tickets isn’t enough. True success lies in understanding performance, identifying bottlenecks, and proactively improving service quality. This requires a sharp focus on the right data. Many organizations track basic numbers, but unlocking real operational excellence means digging deeper into a curated set of service desk metrics. These key performance indicators (KPIs) transform raw data into actionable insights, helping you optimize resource allocation, boost customer satisfaction, and demonstrate tangible value to the business.
This guide moves beyond surface-level ticket counting to provide a detailed roundup of the most critical service desk metrics you should be tracking. We will explore eight essential KPIs, from foundational measures like First Call Resolution (FCR) to strategic indicators such as Cost Per Ticket. For each metric, you’ll find a clear breakdown of why it matters, how to calculate it accurately, and practical strategies for improvement.
By the end of this article, you will have a clear roadmap to not only measure your service desk’s performance but also to actively enhance its efficiency and impact. Get ready to build a more effective and data-driven support operation.
1. First Call Resolution (FCR)
First Call Resolution, often abbreviated as FCR, is a cornerstone of effective service desk management. This metric calculates the percentage of incoming tickets or user issues that are fully resolved during the very first interaction. A high FCR means users get their problems solved quickly and efficiently, without needing to make follow-up calls, send more emails, or wait for escalations. It’s a powerful indicator of both agent proficiency and process efficiency.

Among the many service desk metrics, FCR stands out because it directly correlates with customer satisfaction. Resolving an issue on the first contact prevents user frustration and builds confidence in your support team. For instance, Microsoft’s support organization famously improved its FCR from 67% to 85% by implementing robust knowledge management systems, directly boosting user trust.
Why FCR is a Critical Service Desk Metric
Tracking FCR is essential for any service desk aiming for excellence. A high FCR reduces operational costs by minimizing the time agents spend on repeat contacts for the same issue. It also provides a clear benchmark for agent performance and the effectiveness of your support tools and training programs. Organizations like Zappos maintain a 75% FCR by empowering agents with the authority and training to solve problems independently.
How to Improve Your FCR Rate
Boosting your FCR requires a strategic, multi-faceted approach. Here are actionable steps to optimize this crucial metric:
- Empower Your Agents: Grant agents the necessary permissions and authority to resolve common issues without needing managerial approval. This includes tasks like password resets, software installations, and access requests.
- Build a Comprehensive Knowledge Base: Equip your team with detailed, easy-to-navigate knowledge bases and decision trees. This ensures consistent and accurate solutions are readily available.
- Verify Resolution: Instead of relying solely on an agent marking a ticket as “resolved,” implement a process to confirm resolution. This can be a short automated survey or a follow-up call to the user a day later to ensure the issue is truly fixed.
- Analyze Non-FCR Tickets: Regularly review tickets that were not resolved on the first contact. Conduct root cause analysis to identify patterns, whether they are training gaps, knowledge base deficiencies, or process bottlenecks that need addressing.
2. Mean Time to Resolution (MTTR)
Mean Time to Resolution, or MTTR, is a critical performance indicator that measures the average time elapsed from when a ticket is first opened until it is fully resolved. This metric encompasses the entire lifecycle of a support issue, providing a holistic view of your team’s efficiency and responsiveness. A lower MTTR suggests a streamlined and effective resolution process, highlighting your team’s ability to diagnose and fix problems swiftly.
Among the most vital service desk metrics, MTTR offers deep insights into process bottlenecks and the overall health of your support operations. It directly impacts user experience, as prolonged resolution times can lead to significant frustration and productivity loss. For example, IBM’s service desk famously reduced its MTTR from 72 to just 24 hours by leveraging AI-powered diagnostics and automated ticket routing, dramatically improving their service delivery.
Why MTTR is a Critical Service Desk Metric
Tracking MTTR is fundamental for identifying inefficiencies within your support workflow. It helps you understand not just how quickly an issue is picked up, but how long it takes to deliver a final, working solution. Monitoring this metric allows you to set realistic service level agreements (SLAs) and pinpoint areas ripe for improvement, whether in agent training or system automation. For instance, many ITIL-compliant organizations maintain an MTTR of two to four hours for Priority 1 incidents.
How to Improve Your MTTR Rate
Reducing your MTTR requires a focus on optimizing every stage of the ticket lifecycle. Here are actionable strategies to enhance this key metric:
- Segment by Priority: Set different MTTR targets for different priority levels and ticket types. A critical system outage should have a much shorter target MTTR than a minor software update request.
- Implement Automated Escalations: Use automation to create rules that escalate aging tickets to senior staff or management. This prevents issues from getting stuck in a queue and breaching SLAs.
- Track by Category: Analyze MTTR for different categories of issues, such as hardware failures, software bugs, or access requests. This helps identify specific areas that may need process refinement or better knowledge base articles.
- Use Median and Percentiles: Supplement the mean (average) with the median time to resolution to get a clearer picture of typical performance, unaffected by extreme outliers. For SLA commitments, consider using percentile measurements (e.g., ensuring 90% of tickets are resolved within X hours).
3. Customer Satisfaction Score (CSAT)
Customer Satisfaction Score, universally known as CSAT, measures how satisfied users are with the resolution of their tickets or their overall service experience. It provides direct, qualitative feedback on service quality from the end-user’s perspective. Typically gathered through simple, post-interaction surveys, CSAT is one of the most direct service desk metrics for gauging user sentiment and the perceived value of your support.

Unlike operational metrics that measure efficiency, CSAT measures effectiveness through the user’s eyes. High CSAT scores indicate that your service desk isn’t just closing tickets but is genuinely solving problems and creating positive experiences. For instance, Apple’s technical support consistently achieves CSAT scores above 85% by investing heavily in agent training and empowerment, while Amazon Web Services maintains scores over 90% by prioritizing proactive communication during service incidents.
Why CSAT is a Critical Service Desk Metric
Tracking CSAT is vital because it provides the “why” behind your operational data. A high First Call Resolution rate is good, but if users are still dissatisfied, CSAT will reveal the underlying issue, such as a rude agent or an incomplete solution. Salesforce famously improved its CSAT from 78% to 87% by implementing personalized service approaches, demonstrating that how you deliver support is as important as the solution itself. This feedback loop is essential for continuous service improvement and fostering user loyalty.
How to Improve Your CSAT Score
Improving your CSAT involves capturing feedback effectively and acting on it decisively. Here are proven strategies to boost your customer satisfaction:
- Time Your Surveys: Send CSAT surveys immediately after a ticket is closed. This ensures the interaction is still fresh in the user’s mind, leading to more accurate feedback and higher response rates.
- Keep It Simple: To maximize participation, keep your surveys short and to the point. A single question like “How satisfied were you with our support?” with a 1-5 scale is often enough.
- Implement a Closed-Loop Process: Don’t let negative feedback disappear into a void. Create a process to follow up with dissatisfied users to understand their issues better and, where possible, make things right.
- Correlate with Other Metrics: Analyze CSAT scores alongside metrics like FCR and Mean Time to Resolution (MTTR). This helps identify powerful correlations, such as how resolution speed impacts user happiness or which types of issues generate the lowest scores.
4. Ticket Volume Trends
Ticket Volume Trends measure the number of service requests and incidents received by the service desk over specific periods. This metric is crucial for understanding demand patterns, planning resource capacity, and identifying systemic issues before they escalate. A clear view of ticket volume helps organizations move from a reactive to a proactive support model, anticipating needs rather than just responding to them. It’s a fundamental metric for strategic planning and operational management.
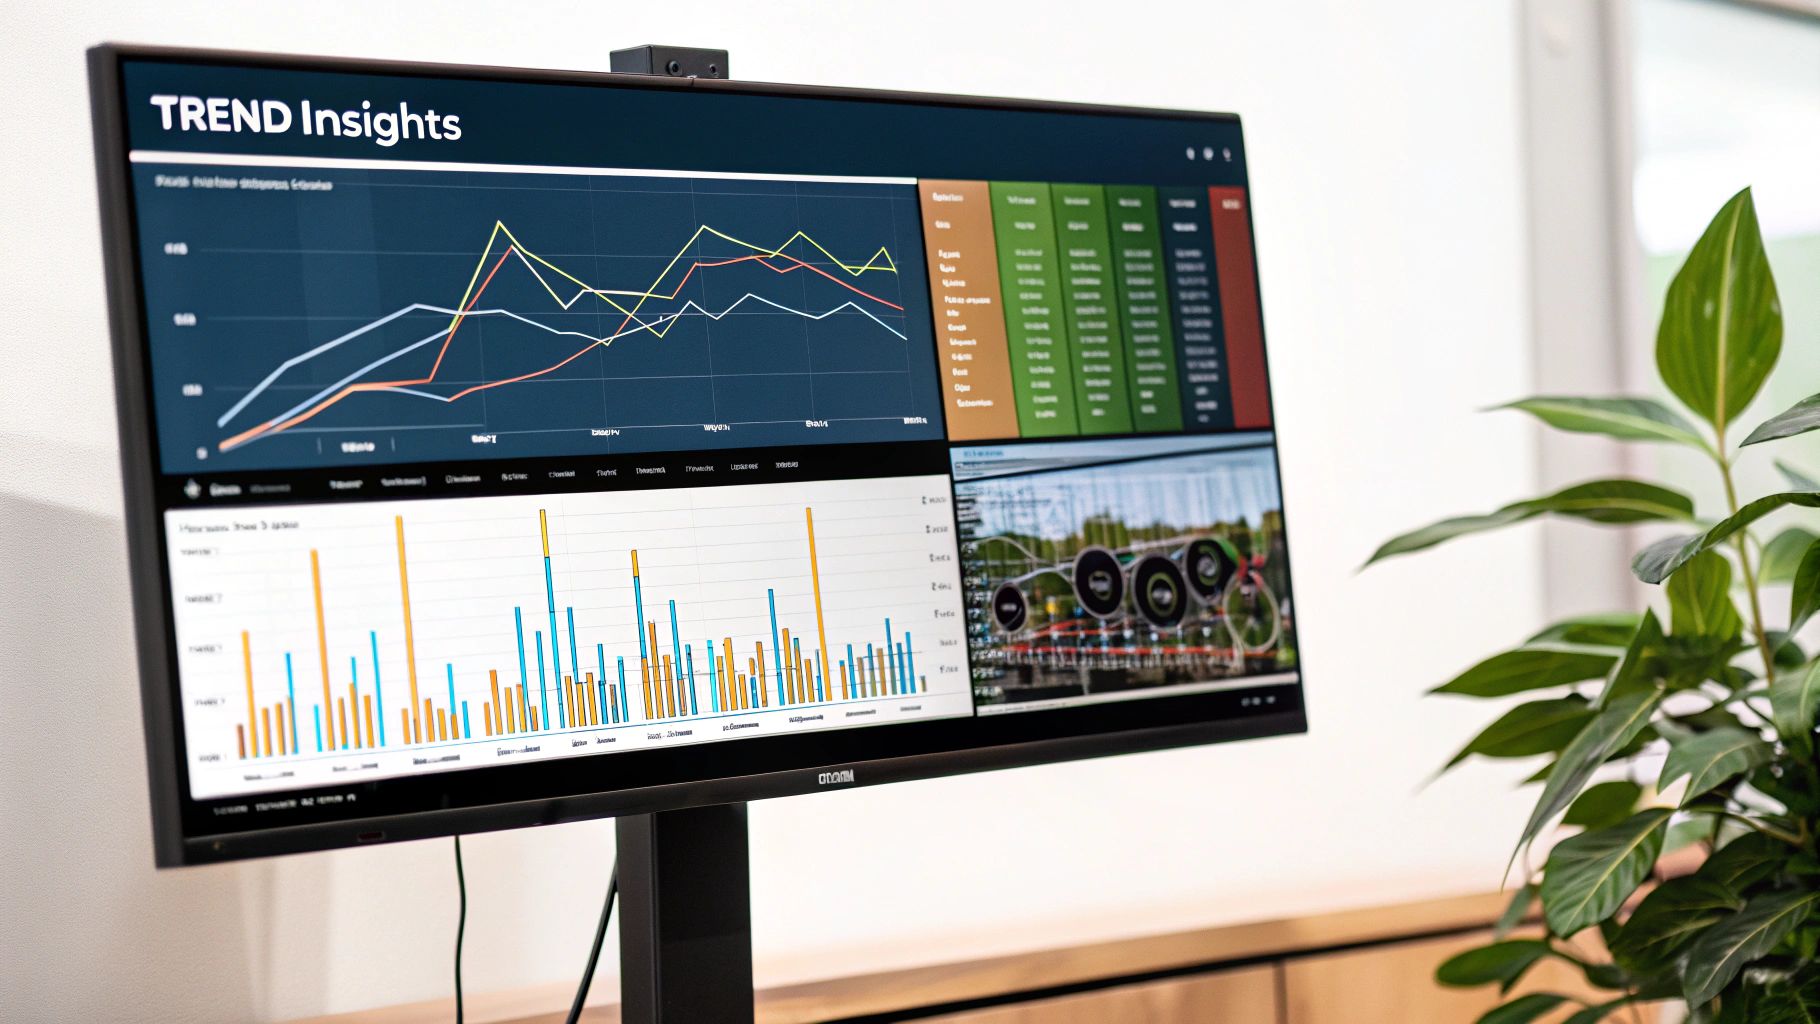
Among the most impactful service desk metrics, analyzing volume trends provides a direct line of sight into the health of your IT environment. It tells you not just how many issues are occurring, but when and why. For example, Spotify successfully reduced its ticket volume by 30% by analyzing trends, which pointed to specific recurring problems that could be addressed with proactive, permanent fixes. This demonstrates how trend analysis directly leads to service improvements and cost savings.
Why Ticket Volume Trends are a Critical Service Desk Metric
Tracking ticket volume is essential for resource allocation and incident prevention. It allows you to staff appropriately for peak times, such as Mondays or after a major software release, preventing agent burnout and maintaining service levels. Companies like Microsoft, handling over 50,000 tickets daily, rely heavily on trend analysis to predict staffing needs across global service desks and anticipate support demands. It transforms the service desk from a simple cost center into a strategic business asset.
How to Improve Your Use of Ticket Volume Trends
Effectively leveraging this metric goes beyond simple counting. It requires deeper analysis and a proactive mindset. Here are actionable steps to get the most from your volume data:
- Implement Automated Categorization: Use automation to categorize incoming tickets consistently. This ensures that your trend analysis is based on accurate, reliable data, allowing you to spot meaningful patterns in specific issue types.
- Analyze by Different Dimensions: Don’t just look at the total number. Segment your data by time of day, department, ticket category, and source (email, phone, portal). This granular view helps pinpoint the root causes of volume spikes.
- Correlate Volume with Business Events: Link ticket volume trends to internal and external events, such as system updates, marketing campaigns, or new feature launches. This correlation provides context and helps you prepare for future events.
- Use Predictive Analytics: Leverage historical data to forecast future ticket volumes. Predictive models can help you anticipate demand, schedule staff more effectively, and proactively address issues before they impact a large number of users.
5. Service Level Agreement (SLA) Compliance
Service Level Agreement (SLA) Compliance is a foundational metric that measures the service desk’s ability to meet its promises. It calculates the percentage of tickets resolved within the predefined timeframes outlined in your SLAs. These agreements set clear expectations with users for response and resolution times, making this metric a direct reflection of your team’s reliability and commitment to service quality. A high SLA compliance rate is essential for maintaining customer trust and meeting contractual obligations.
Among the various service desk metrics, SLA compliance provides a clear, objective measure of performance against documented standards. It moves beyond subjective user feelings to provide hard data on service delivery. For instance, IBM’s managed services division achieved an impressive 99.5% SLA compliance by implementing automated workflow optimization, demonstrating how process refinement directly impacts reliability.
This summary box highlights typical SLA benchmarks, including industry compliance rates and distinct targets for different ticket priorities.
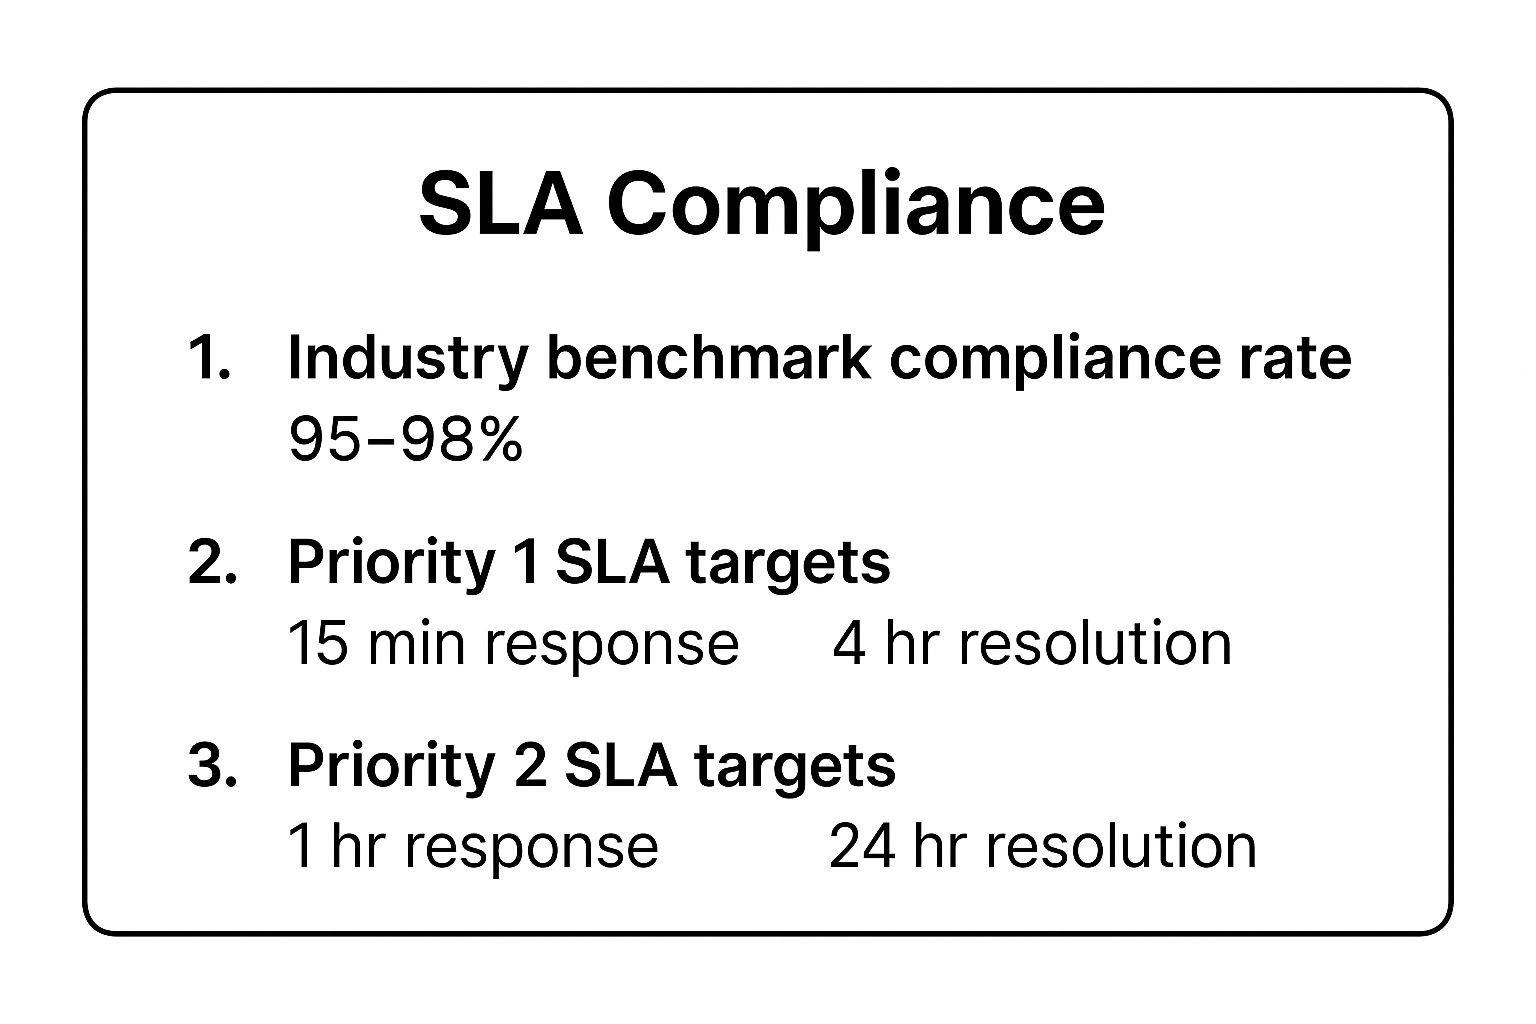
These benchmarks underscore the need for a tiered support structure, ensuring that the most critical issues receive the fastest attention.
Why SLA Compliance is a Critical Service Desk Metric
Tracking SLA compliance is non-negotiable for any service desk that operates under formal service agreements. It serves as a critical performance indicator for both internal management and external clients, proving the value and dependability of your support function. A consistently high compliance rate, like the 98% maintained by Accenture across its global operations, showcases operational excellence and can be a key differentiator in a competitive market.
How to Improve Your SLA Compliance Rate
Boosting your SLA compliance requires a combination of proactive planning, smart automation, and continuous review. Here are actionable steps to enhance this vital metric:
- Set Realistic and Tiered SLAs: Define SLA targets based on historical data and ticket priority. High-priority incidents should have aggressive targets (e.g., 15-minute response), while lower-priority requests can have longer timeframes.
- Implement Automated Escalations: Configure your help desk software to automatically escalate tickets that are approaching their SLA deadlines. This ensures at-risk tickets get immediate attention before a breach occurs.
- Establish Clear “Pause” Conditions: Create formal rules for pausing the SLA clock when you are waiting for a response from the user or a third-party vendor. This prevents external delays from negatively impacting your metrics.
- Regularly Review and Adapt: Don’t treat your SLAs as static. Periodically review performance reports to identify bottlenecks and update your targets as your team’s capabilities and services evolve. Wipro, for example, improved compliance from 85% to 96% by using predictive analytics to better align resources with demand.
6. Agent Utilization Rate
Agent Utilization Rate measures the percentage of an agent’s logged-in time that is spent on productive, work-related activities. This includes direct ticket handling, customer communication, training, and updating knowledge base articles. It’s a key metric for understanding workforce productivity and ensuring that your staffing levels are aligned with your workload. A well-managed utilization rate ensures you are making the most of your resources without overworking your team.
Among the various service desk metrics, Agent Utilization Rate is crucial for operational efficiency and cost management. It helps managers identify if agents are consistently idle or if they are stretched too thin, which can lead to burnout and a decline in service quality. For example, Teleperformance famously improved its utilization from 65% to 78% by implementing advanced workforce optimization tools, leading to significant cost savings and better service delivery.
Why Agent Utilization Rate is a Critical Service Desk Metric
Tracking Agent Utilization is vital for balancing performance with employee well-being. It helps optimize scheduling, forecast future staffing needs, and identify opportunities for process automation. An optimal rate, typically between 70-80%, indicates a productive team that also has time for essential non-ticket activities like training and collaboration. Companies like Cognizant maintain a 75-80% utilization rate across their global service centers to ensure consistent productivity and high-quality outcomes.
How to Improve Your Agent Utilization Rate
Optimizing your utilization rate is about smart management, not just pushing agents to work harder. Here are actionable steps to balance this metric effectively:
- Set Realistic Targets: Avoid aiming for 100% utilization, which is unsustainable and leads to burnout. A target of 70-80% allows for necessary breaks, training, and administrative tasks that contribute to long-term success.
- Use Workforce Management (WFM) Tools: Implement WFM software to automate scheduling, forecast ticket volume, and manage agent availability. This helps match staffing levels precisely with demand patterns, reducing idle time.
- Count All Productive Work: Ensure your definition of “utilization” includes all value-added activities, not just call or ticket time. This should encompass time spent on training, updating documentation, and mentoring peers.
- Monitor Alongside Quality Metrics: Track utilization in tandem with metrics like CSAT and FCR. A high utilization rate is meaningless if service quality is suffering. This balanced view ensures you are driving productive, high-quality work.
7. Escalation Rate
Escalation Rate is a crucial service desk metric that measures the percentage of support tickets requiring transfer to a higher-level support tier, a specialized team, or management for resolution. A high escalation rate can signal that first-level agents lack the training, tools, or authority to resolve issues. Conversely, a low rate often indicates a highly capable and well-equipped front-line team. This metric is a powerful diagnostic tool for assessing the efficiency of your tiered support structure.
Among the various service desk metrics, Escalation Rate provides deep insights into process gaps and the effectiveness of your Level 1 support. When first-level agents are empowered, they can handle more complex issues, preventing bottlenecks and improving resolution times. For instance, VMware successfully reduced its escalation rates from 25% to just 15% by equipping its Level 1 agents with better diagnostic tools, allowing them to solve more problems independently.
Why Escalation Rate is a Critical Service Desk Metric
Tracking your Escalation Rate is fundamental to building a cost-effective and scalable support operation. Each escalation adds to the overall cost and time required to resolve an issue. By monitoring this metric, you can pinpoint specific knowledge gaps or process inefficiencies that force tickets up the support chain. Oracle’s renowned support organization maintains a low 12% escalation rate, a direct result of its continuous investment in a comprehensive and easily accessible knowledge base.
How to Improve Your Escalation Rate
Lowering your Escalation Rate requires a focus on empowering your front-line team and refining your support processes. Here are actionable steps to optimize this important metric:
- Establish Clear Escalation Criteria: Define and document exactly when an issue should be escalated. This prevents unnecessary transfers and ensures consistency across the team. A well-defined issue escalation process on resolution.de is the foundation for managing this metric effectively.
- Track and Analyze Escalation Reasons: Categorize every escalated ticket by its root cause, such as “lack of permissions,” “training gap,” or “software bug.” This data reveals systemic problems that need to be addressed at a higher level.
- Create Strong Feedback Loops: Implement a formal process for higher-level tiers to provide detailed feedback and resolution notes back to Level 1. This turns every escalation into a learning opportunity, building the institutional knowledge of your front-line agents.
- Invest in Targeted Training: Use escalation data to identify recurring themes and develop specific training modules. If many escalations relate to a particular application, targeted training on that system can significantly reduce future escalations.
8. Cost Per Ticket
Cost Per Ticket is a crucial financial metric that calculates the total expense associated with resolving a single support request. This calculation goes beyond just agent salaries; it encompasses all direct and indirect costs, including labor, technology licensing, training, and a portion of overheads like facilities and utilities. A clear understanding of this cost provides a powerful baseline for measuring operational efficiency and identifying opportunities for financial optimization.
Among the many service desk metrics, Cost Per Ticket offers a tangible link between support activities and business finances. It helps leadership understand the economic impact of their service desk and make informed decisions about resource allocation. For example, Gartner research indicates the average cost for a Level 1 ticket can be between $15 and $25, but this figure can be dramatically reduced. Organizations that implement AI-driven chatbots often see a 40-50% reduction in this cost for common, repetitive inquiries.
Why Cost Per Ticket is a Critical Service Desk Metric
Tracking Cost Per Ticket is essential for running a sustainable and efficient service desk. It shifts the focus from purely operational metrics to a more business-oriented view, justifying investments in new technologies or process improvements. By analyzing this metric, managers can pinpoint inefficiencies, such as overly complex escalation paths or a lack of agent training, that drive up expenses. This data provides the foundation for building a compelling business case for change.
How to Reduce Your Cost Per Ticket
Lowering your Cost Per Ticket without sacrificing quality requires a strategic approach that balances efficiency with effectiveness. Here are actionable steps to optimize this vital metric:
- Invest in Self-Service and Automation: The most effective way to reduce costs is to deflect tickets entirely. Develop a robust knowledge base, user-friendly self-service portals, and automated solutions like chatbots to handle routine requests, freeing up agents for more complex issues.
- Segment Your Cost Analysis: Don’t treat all tickets equally. Analyze costs based on ticket type, complexity, and resolution channel. This provides granular insights into where your money is being spent most and which areas offer the greatest potential for savings.
- Use Activity-Based Costing: For a truly accurate picture, use activity-based costing to allocate all relevant service desk expenses. This method precisely assigns costs for labor, technology, and overheads to the ticket resolution process.
- Track Alongside Quality Metrics: Never optimize for cost alone. Always track Cost Per Ticket in conjunction with CSAT and FCR. The goal is to lower costs while maintaining or improving service quality, not to cut corners at the user’s expense. For more ideas, explore these IT cost reduction strategies on resolution.de.
Key Metrics Comparison of 8 Service Desk Indicators
| Metric | Implementation Complexity 🔄 | Resource Requirements ⚡ | Expected Outcomes 📊 | Ideal Use Cases 💡 | Key Advantages ⭐ |
|---|---|---|---|---|---|
| First Call Resolution (FCR) | Medium – requires knowledge bases & agent authority | Moderate – training, tools | Higher customer satisfaction, reduced repeat contacts | Customer support aiming to increase resolution speed | Directly boosts customer loyalty and productivity |
| Mean Time to Resolution (MTTR) | Medium – needs tracking & automated escalation | Moderate to high – analytics tools | Faster resolution, bottleneck identification | Service desks focused on efficiency and SLA adherence | Clear performance visibility and process insights |
| Customer Satisfaction Score (CSAT) | Low – survey implementation and data collection | Low to moderate – survey tools | Direct feedback on service quality | Measuring customer perception of support quality | Easy to communicate, identifies improvement areas |
| Ticket Volume Trends | Medium – requires data segmentation & dashboards | Moderate – analytics and BI tools | Demand forecasting and capacity planning | Capacity planning, identifying systemic issues | Supports proactive service improvements |
| SLA Compliance | Medium to high – SLA definitions & automated tracking | Moderate – workflow automation | Meeting contractual commitments, trust maintenance | Ensuring contractual service delivery and reliability | Objective performance measure, improves processes |
| Agent Utilization Rate | Medium – time tracking and workforce tools | Moderate – scheduling software | Staff productivity optimization | Workforce planning and productivity analysis | Identifies training needs and optimizes costs |
| Escalation Rate | Low to medium – tracking and criteria definition | Moderate – reporting and training | Identifies support gaps, improves escalation process | Improving first-level support effectiveness | Helps optimize support tiers and training |
| Cost Per Ticket | Medium – financial tracking and activity costing | High – accounting & analytics tools | Cost optimization while maintaining service quality | Budget planning and cost-management initiatives | Financial transparency, supports automation ROI |
From Metrics to Mastery: Unifying Your Service Desk Data
Navigating the landscape of service desk metrics can feel like trying to steer a ship using eight different compasses. We’ve explored critical indicators like First Call Resolution (FCR), Mean Time to Resolution (MTTR), and Customer Satisfaction (CSAT), each offering a unique snapshot of your support operations. From tracking Ticket Volume Trends to ensure you’re adequately staffed, to monitoring Escalation Rates to identify knowledge gaps, each metric is a vital piece of a much larger puzzle.
The true challenge, however, isn’t merely tracking these KPIs in isolation. The path from data collection to operational mastery lies in synthesis. True insight emerges when you start connecting the dots. For example, a concerted effort to improve your FCR by equipping agents with better tools and knowledge will almost certainly lead to a lower Cost Per Ticket and a higher CSAT score. Similarly, analyzing why your SLA Compliance rate dipped can reveal underlying issues with agent workload, directly tied to the Agent Utilization Rate.
Turning Isolated Data into a Cohesive Strategy
Achieving this unified view requires moving beyond siloed data streams. Your service desk doesn’t operate in a vacuum; it’s the frontline of your customer experience, deeply intertwined with sales, marketing, and product development. When a support agent in Jira is handling a ticket, they need more than just the technical details of the problem. They need the full customer story: Are they a new customer or a long-term champion? What is their recent purchase history? Have they encountered similar issues before?
This is where integrating your core platforms becomes a strategic imperative. By embedding crucial customer context from your CRM, like HubSpot, directly into your ITSM tool, like Jira, you empower your agents. They no longer have to switch between tabs or hunt for information. This seamless access to a 360-degree customer view is the key to:
- Improving FCR: Agents can resolve issues faster and more accurately on the first attempt.
- Reducing Escalations: With full context, front-line agents can handle more complex inquiries.
- Boosting CSAT: Customers feel understood and valued, leading to a better overall experience.
Visualizing Success and Taking Action
Once your data is integrated, the final step is effective visualization. Raw numbers on a spreadsheet are difficult to interpret. A well-designed dashboard transforms complex service desk metrics into clear, actionable insights that tell a story at a glance. To truly achieve mastery from your service desk data, effective visualization is key. You can find inspiration in how other departments leverage data, for instance, by exploring HR dashboard examples to inspire you in 2025 to see how powerful visual storytelling can be.
By implementing a cohesive metrics strategy, integrating your essential tools, and presenting the data in an intuitive format, you can elevate your service desk. It shifts from being a reactive cost center to a proactive, data-driven engine of customer retention and business value.
Ready to break down the silos between your support and sales teams? Discover how resolution Reichert Network Solutions GmbH can seamlessly integrate HubSpot and Jira, giving your agents the complete customer context they need to master your service desk metrics. Learn more and start your free trial today.
