
Unleash the Power of Data Harmony
Tired of data silos between Jira and HubSpot? This listicle showcases seven Jira dashboard examples, empowering you to centralize crucial information and optimize workflows across various teams—from development and support to sales and marketing. Learn how these dashboards solve common data disconnects, providing actionable insights to boost productivity and collaboration. Discover how a unified view can transform your team's performance, featuring examples for agile project management, DevOps, and customer support.
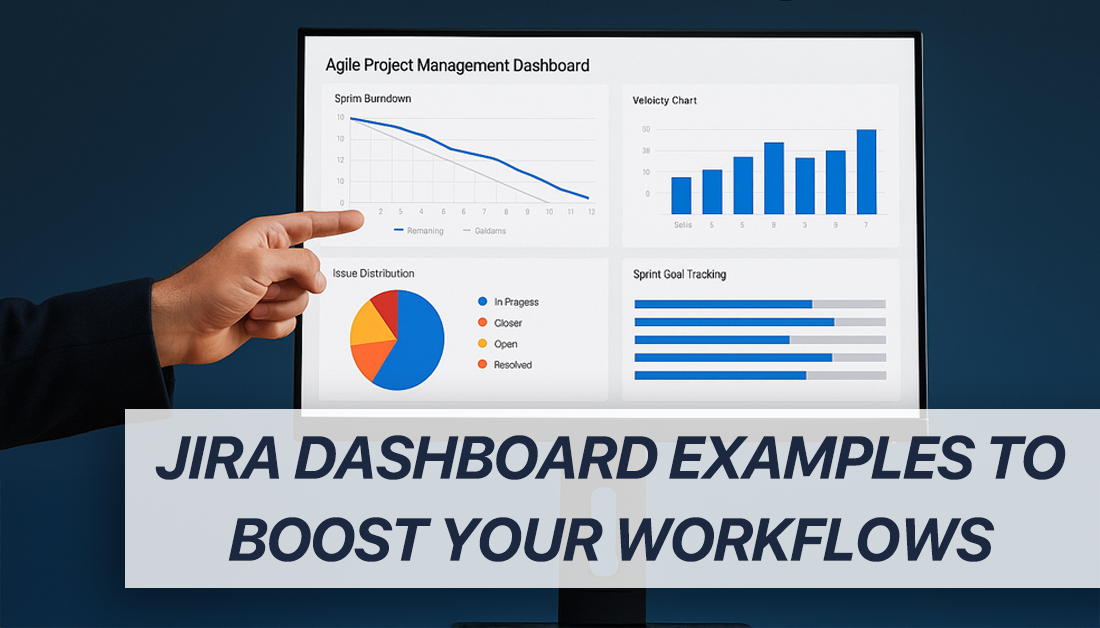
1. Agile Project Management Dashboard
Jira dashboard examples are crucial for teams seeking to visualize project progress and identify potential roadblocks. One powerful example is the Agile Project Management Dashboard, a pre-built template designed specifically for teams utilizing Agile methodologies like Scrum or Kanban. This dashboard offers a comprehensive view of sprint progress, backlog health, and team velocity, making it an invaluable tool for product owners, scrum masters, and development teams alike. This dashboard warrants its place on this list due to its focus on Agile principles, its comprehensive overview of key metrics, and its adaptability to various team workflows. It's an excellent starting point for teams looking to improve their Agile practices within Jira.
Features and Benefits:
This Jira dashboard example packs a punch with features designed to enhance Agile workflows:
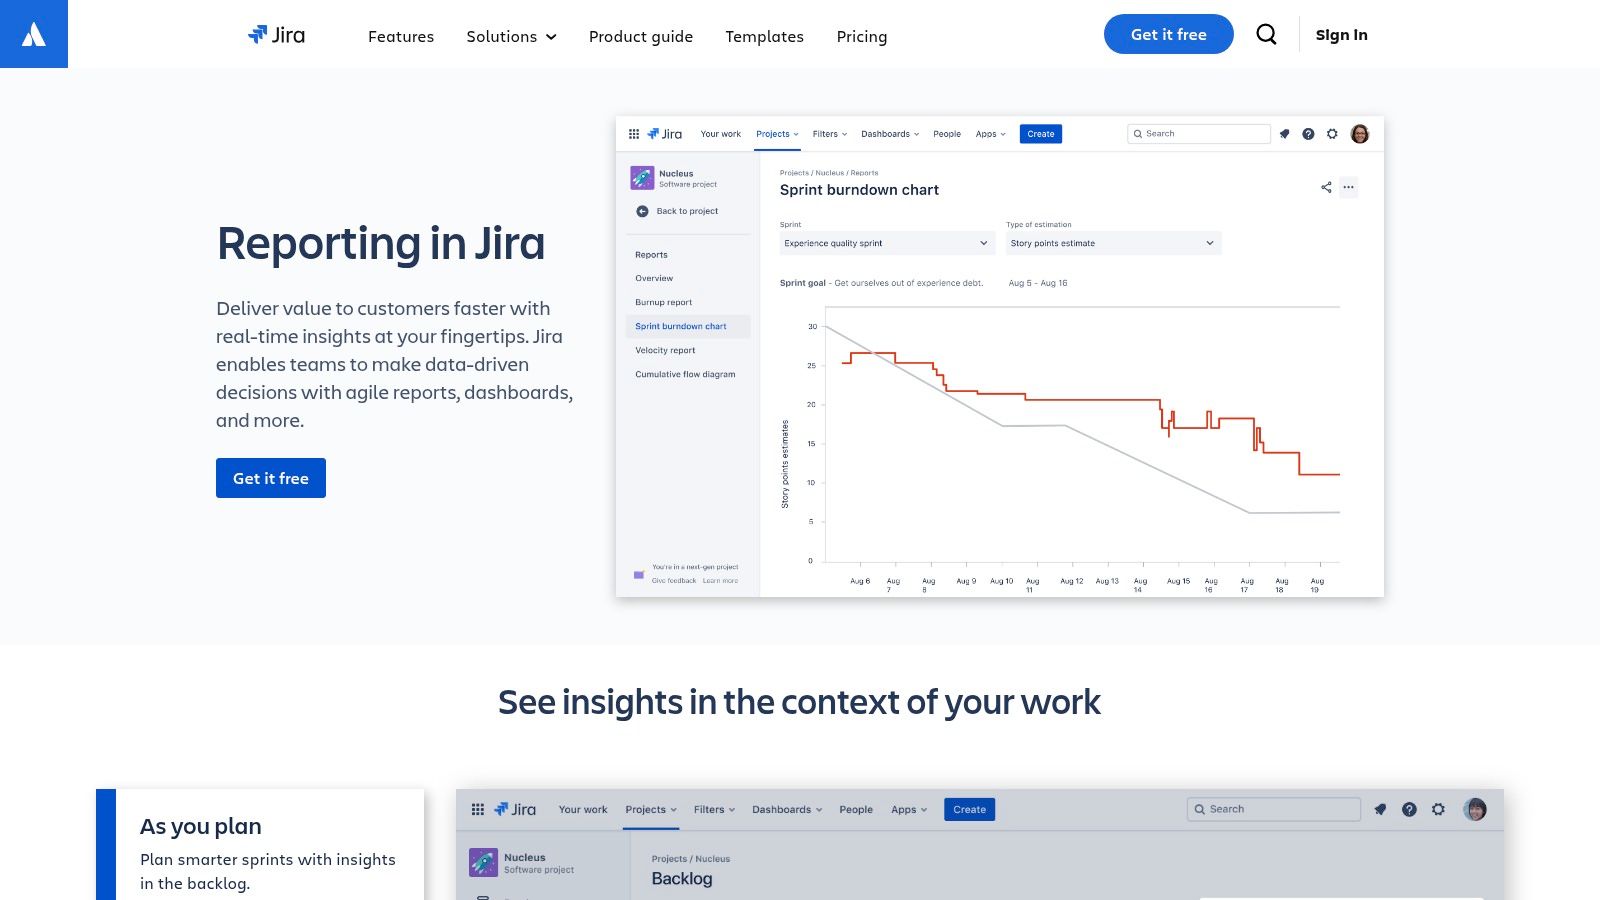
- Sprint Burndown Charts: Visualize planned vs. actual sprint progress, helping teams stay on track and identify potential delays early on. This real-time visibility is critical for effective sprint management.
- Velocity Charts: Track team performance across sprints to understand historical velocity and better predict future sprint capacity. This data-driven approach enables more realistic sprint planning.
- Backlog Health Metrics: Gain insights into the grooming status of your backlog to ensure it's refined and ready for upcoming sprints. A healthy backlog is essential for a smooth development process.
- Issue Distribution: View issue distribution by assignee, priority, and status to understand workload balance and identify potential bottlenecks. This promotes better resource allocation and task management.
- Sprint Goal Tracking: Monitor progress towards sprint goals and track completion metrics to ensure the team is aligned and focused on delivering value. This reinforces the importance of sprint goals and promotes team accountability.
Pros:
- Real-time Visibility: Provides up-to-the-minute insights into sprint progress, enabling proactive adjustments and quicker responses to changing conditions.
- Bottleneck Identification: Helps identify bottlenecks in the development process by visualizing workflow and task distribution, allowing for targeted improvements.
- Data-Driven Planning: Facilitates data-driven sprint planning by leveraging historical velocity data and backlog health metrics, leading to more accurate estimations.
- Improved Resource Allocation: Enables better resource allocation across team members by providing a clear overview of workload distribution and task assignments.
Cons:
- Information Overload: Can become overwhelming if too many gadgets are added to the dashboard, potentially obscuring critical information. Start with the essentials and add more as needed.
- Requires Consistent Practices: Requires consistent sprint practices to generate meaningful data. Inconsistent data entry can lead to inaccurate reporting and flawed insights.
- Customization May Be Needed: May require customization to perfectly align with specific team workflows, particularly for teams with highly specialized processes. Jira allows for customization to address this.
Implementation and Setup Tips:
- Start with the default Agile Project Management Dashboard template available within Jira.
- Customize the gadgets to display the most relevant metrics for your team's specific needs.
- Ensure consistent data entry practices to maintain data integrity and generate accurate reports.
- Regularly review and refine the dashboard based on team feedback and evolving project requirements.
Comparison with Similar Tools:
While other project management tools may offer similar dashboards, Jira's tight integration with other Atlassian products and its extensive customization options make it a powerful choice for Agile teams. This dashboard provides a solid foundation upon which to build a robust reporting and tracking system.
Pricing and Technical Requirements:
This dashboard is available as a standard feature within Jira Software and Jira Data Center. Specific pricing for Jira can be found on the Atlassian website (https://www.atlassian.com/software/jira/pricing). Technical requirements will vary based on your Jira deployment (cloud vs. server).
Website: https://www.atlassian.com/software/jira/templates/agile-project-management
This specific Jira dashboard example is particularly relevant for our target audience of Jira administrators, DevOps managers, and product/project management teams. It provides a clear and actionable way to visualize project progress and enhance Agile workflows, directly addressing the needs of these roles. While this dashboard provides substantial value on its own, it can be further enhanced through integrations like HubSpot for Jira, which allows for seamless synchronization between Jira issues and HubSpot CRM data, providing even greater context and insight. This integration enhances the dashboard's utility for sales and marketing teams, customer support agents, and data analysts as well, allowing them to see how development work impacts customer-facing activities and vice-versa.
2. DevOps Performance Dashboard: A Jira Dashboard Example for Streamlined Development
The DevOps Performance Dashboard is a powerful Jira dashboard example that empowers teams to gain a comprehensive overview of their development and deployment pipeline. This dashboard facilitates continuous improvement by providing clear visibility into key DevOps metrics such as cycle time, deployment frequency, code quality, and incident management. It helps bridge the gap between development and operations teams by tracking the flow of issues from creation to deployment, fostering collaboration and shared responsibility. For DevOps managers striving to optimize their processes, this dashboard is an invaluable tool.
This dashboard deserves its place in this list of Jira dashboard examples because it directly addresses the need for increased visibility and efficiency within DevOps practices. By centralizing key performance indicators (KPIs) in one location, teams can easily identify bottlenecks, assess risks, and track progress towards their goals. This focus on data-driven decision making is critical for successful DevOps implementation. Learn more about DevOps Performance Dashboard and the tools that support this approach. This is particularly helpful for teams who are already leveraging tools like HubSpot for Jira to integrate customer feedback and support data directly into their development workflow.
Features and Benefits:
- Cycle time and lead time metrics: Track the time it takes to complete different issue types, enabling identification of areas for improvement in the development process.
- Deployment frequency and success rate tracking: Monitor the frequency and success of deployments, allowing for quick assessment of deployment pipeline efficiency and reliability.
- Code quality indicators: Integrate with code quality tools to display code quality metrics directly on the dashboard, providing immediate feedback on code health.
- Build and deployment status gadgets: View the status of builds and deployments in real-time, enabling rapid identification and resolution of any issues.
- Incident and rollback tracking: Monitor incidents and rollbacks, providing valuable insights into the stability and resilience of the system. Connecting this data with customer feedback within HubSpot can provide crucial context for resolving customer issues.
Pros:
- Improved Collaboration: Bridges the gap between development and operations teams, fostering a culture of shared responsibility.
- Data-Driven Insights: Provides clear metrics for continuous improvement, enabling data-backed decisions.
- Risk Mitigation: Helps identify deployment bottlenecks and risks, allowing for proactive mitigation strategies.
- DORA Metrics Support: Supports the implementation of DORA metrics, providing a framework for measuring and improving DevOps performance.
Cons:
- Integration Requirements: Requires integration with CI/CD tools for full functionality, which may involve some initial setup effort.
- Plugin Dependency: May need additional plugins for comprehensive metrics tracking depending on your specific requirements.
- Initial Complexity: Can be complex to set up initially, requiring some familiarity with Jira administration and configuration.
Pricing and Technical Requirements:
The DevOps Performance Dashboard leverages Jira's core functionality and reporting features, meaning there are no additional licensing costs beyond your existing Jira subscription. However, integrating with external CI/CD tools and other platforms (like HubSpot) might have associated costs. Technical requirements will vary depending on the chosen integrations, but generally require a working Jira instance and access to relevant APIs.
Implementation Tips:
- Start small: Begin with a few key metrics and gradually add more as your team matures.
- Customize for your needs: Tailor the dashboard to reflect your specific team's workflows and goals.
- Integrate with existing tools: Connect with your CI/CD pipeline and other relevant tools to maximize the value of the dashboard. Consider integrating with HubSpot to gain valuable customer context and feedback.
- Regularly review and refine: Continuously review the dashboard and make adjustments based on your team's evolving needs and feedback.
Website: Jira Software – Reports and dashboards | Atlassian
This dashboard is a valuable tool for Jira administrators, DevOps managers, and other stakeholders involved in the software development lifecycle. By providing a centralized view of key DevOps metrics, it empowers teams to improve their processes, reduce risks, and deliver high-quality software faster. Its integration potential with other tools, such as HubSpot, further extends its value by providing a holistic view of the entire software delivery process, from customer feedback to deployment.
3. Executive Overview Dashboard: High-Level Insights for Strategic Decision-Making
The Executive Overview Dashboard is a prime example of how Jira dashboards can be tailored for specific needs, in this case, providing leadership teams with a concise view of project health, resource allocation, and progress towards business objectives. This dashboard deserves its place on this list because it bridges the gap between technical execution and strategic oversight, making it invaluable for data-driven decision-making at the highest level. For executives juggling multiple projects and priorities, this dashboard offers a crucial at-a-glance summary of what matters most. It's particularly useful for rev-ops leaders, support managers, and product teams who need to understand the impact of technical work on broader business goals within their HubSpot CRM.
This dashboard utilizes simplified visualizations and Key Performance Indicators (KPIs) to present the most critical information without overwhelming viewers with technical details. Imagine needing to quickly brief stakeholders on the status of several key initiatives. Instead of sifting through complex reports, the Executive Overview Dashboard gives you the essential information – project health, resource utilization, budget adherence, and milestone progress – all in one easily digestible view. This seamless access to crucial data empowers executives to proactively address potential roadblocks and keep projects aligned with strategic objectives, fostering a culture of data-driven decision-making.
Key Features and Benefits:
- Project Health Indicators with RAG (Red/Amber/Green) Status: Instantly understand the overall health of each project with clear color-coded indicators, allowing for immediate identification of at-risk initiatives. This feature, combined with the HubSpot for Jira integration, allows executives to correlate project status with customer success metrics directly within HubSpot, providing a comprehensive view of impact.
- Resource Allocation and Utilization Charts: Visualize how resources are distributed across projects and identify potential bottlenecks or underutilization. This enables more efficient resource allocation and optimized team performance. By syncing Jira data with HubSpot via the integration, you can further analyze resource allocation against sales performance and marketing campaign effectiveness.
- Budget vs. Actual Tracking Metrics: Monitor project spending against allocated budgets to ensure projects stay on track financially. Integrate this financial data with HubSpot’s sales and marketing data for a holistic view of ROI.
- Milestone Completion Tracking with Forecasting: Track progress towards key milestones and get projected completion dates. This allows for proactive adjustments to timelines and resource allocation, ensuring projects deliver on time. Leverage the HubSpot for Jira integration to connect milestone achievement with customer onboarding progress and other relevant HubSpot data.
- Risk and Blocker Summary: Quickly identify and assess potential risks and blockers that could impede project progress. This proactive risk management capability is essential for keeping projects on track and minimizing potential disruptions. The HubSpot integration allows you to further analyze these risks in the context of customer impact, enabling more informed decision-making.
Pros:
- Provides concise, executive-friendly visualizations.
- Helps align technical work with business objectives.
- Enables proactive risk management at the leadership level.
- Creates transparency between technical teams and executives.
- When combined with HubSpot for Jira, connects project status to customer success metrics for a 360-degree view.
Cons:
- May oversimplify complex technical challenges.
- Requires regular maintenance to ensure accuracy.
- Often needs additional context through meetings.
Implementation and Setup Tips:
- Start with the essentials: Focus on the most critical KPIs for your executive team. Avoid cluttering the dashboard with unnecessary information.
- Use clear and consistent labeling: Ensure all charts and metrics are clearly labeled to avoid confusion.
- Regularly review and update: Keep the dashboard up-to-date with the latest project data to ensure its accuracy and relevance. A key benefit of the HubSpot for Jira integration is the automated data sync, reducing manual updates.
- Consider custom fields: Leverage custom fields in Jira and HubSpot to track specific metrics relevant to your business and display them on the dashboard.
- Integrate with HubSpot: Maximize the value of your Executive Overview Dashboard by integrating Jira with HubSpot using the HubSpot for Jira app. This allows you to connect project data with customer data, providing a more holistic view of business performance. The integration is available on the Atlassian Marketplace and offers a free trial.
Website: https://www.atlassian.com/software/jira/features/dashboards
This dashboard is a crucial tool for aligning technical execution with strategic business objectives. Its concise visualizations and focus on key metrics make it an invaluable resource for executive decision-making. When combined with the power of the HubSpot for Jira integration, the Executive Overview Dashboard becomes even more powerful, connecting project data with customer insights for a truly comprehensive view of business performance.
4. Bug Tracking and Quality Assurance Dashboard
For QA teams and developers, maintaining code quality and squashing bugs efficiently is paramount. A dedicated Bug Tracking and Quality Assurance Dashboard in Jira provides the centralized visibility needed to manage these critical processes. This type of dashboard, a prime example of effective Jira dashboard examples, offers a powerful solution for tracking bugs, defects, and overall quality metrics, enabling teams to prioritize fixes and monitor the health of the codebase. This dashboard deserves its place in this list because it directly addresses a crucial aspect of software development – quality control.

This Jira dashboard example provides a consolidated view of key quality metrics, including bug resolution rates, test coverage, and trends over time. This allows teams to identify bottlenecks, prioritize critical bug fixes, and proactively address potential quality issues. Imagine easily identifying a sudden spike in bugs related to a specific component after a recent release. This dashboard allows you to do just that. The ability to analyze quality trends across sprints and releases also facilitates data-driven quality improvement initiatives. For example, if the dashboard reveals a consistent pattern of bugs related to a particular development practice, the team can adjust their workflow to prevent similar issues in the future.
Key Features and Benefits:
- Bug resolution rate and aging reports: Monitor how quickly bugs are being resolved and identify any lingering issues that require attention. This data helps teams understand their efficiency and pinpoint potential process improvements.
- Bug distribution by component, severity, and priority: Gain insights into where bugs are concentrated, their level of severity, and their priority level. This information is crucial for effective triage and resource allocation.
- Test coverage and execution status: Track the progress of testing efforts and identify areas that require additional testing. This ensures thorough coverage and helps prevent regressions.
- Regression issue tracking: Specifically monitor bugs that have reappeared after supposedly being fixed. This highlights potential problems in the testing or development process.
- Quality trend analysis over sprints/releases: Identify patterns and trends in quality metrics over time, allowing for proactive quality management and continuous improvement.
Pros:
- Centralizes quality metrics: All relevant information is available in a single, easily accessible location.
- Prioritizes bug fixing: Enables efficient prioritization based on data, ensuring that the most critical issues are addressed first.
- Early warning system: Provides early visibility into emerging quality problems, allowing for timely intervention.
- Data-driven improvements: Facilitates data-backed decisions for improving the software development process.
Cons:
- Requires discipline: Effective use depends on consistent and accurate bug reporting practices.
- Potential for quantity over quality: Focus on metrics can sometimes overshadow the actual impact of bugs.
- Integration needs: May require integration with testing tools for optimal functionality.
Implementation and Setup Tips:
- Start with a template: Leverage pre-built Jira templates for bug tracking to expedite setup.
- Customize to your needs: Tailor the dashboard to reflect your specific project requirements and key metrics.
- Integrate with testing tools: Connect with testing platforms to automatically populate the dashboard with relevant data.
- Regularly review and refine: Continuously review and adjust the dashboard to ensure it remains relevant and effective.
HubSpot Integration for Enhanced Workflow:
While this dashboard excels at providing quality insights within Jira, integrating it with HubSpot can further amplify its effectiveness. By connecting Jira with HubSpot using the HubSpot for Jira app, teams can align development efforts with customer feedback and support tickets. This allows developers to directly address customer-reported issues, enhancing customer satisfaction and streamlining communication.
Comparison with Similar Tools:
While other project management tools offer bug tracking functionalities, Jira's robust features and customization options make it a particularly strong choice for complex projects. The ability to create specialized dashboards like the Bug Tracking and Quality Assurance Dashboard further sets it apart.
Website: https://www.atlassian.com/software/jira/templates/bug-tracking
This Bug Tracking and Quality Assurance Dashboard provides a vital tool for managing software quality within Jira. By leveraging its features and integrating it with other tools like HubSpot, teams can significantly improve their development processes and deliver higher-quality software. This makes it a crucial Jira dashboard example for any development team.
5. Service Desk and Customer Support Dashboard
For customer support teams living in Jira Service Management, a dedicated Service Desk Dashboard is a game-changer. This dashboard offers real-time visibility into key support metrics, allowing managers to balance workloads, identify training needs, and proactively address at-risk SLAs. This empowers teams to resolve customer issues efficiently and improve overall satisfaction, directly contributing to customer success. It's a powerful example of how Jira dashboards can be tailored to specific team needs, making it a valuable addition to our list of Jira dashboard examples.

This dashboard is particularly relevant for support managers seeking to streamline operations and improve their team's performance. Imagine having a clear, concise view of ticket volume trends, SLA compliance, and agent performance, all in one place. This dashboard provides exactly that. Features like ticket volume trends categorized by priority, resolution time metrics, and agent workload distribution allow for data-driven staffing decisions and proactive management of potential bottlenecks. Visualizing customer satisfaction scores (CSAT) directly on the dashboard provides immediate feedback on the effectiveness of support efforts.
This kind of deep integration between support metrics and operational workflows is precisely what makes solutions like the HubSpot for Jira app so valuable. By syncing customer data between HubSpot and Jira, support teams gain a richer context for each ticket, leading to faster and more personalized resolutions. Learn more about Service Desk and Customer Support Dashboard to understand how integrating your CRM with Jira can further enhance your support operations.
Features:
- SLA compliance tracking and breach alerts: Proactive alerts ensure that SLAs are met, preventing escalations and maintaining customer trust.
- Ticket volume trends by category and priority: Identify recurring issues and prioritize resources effectively.
- Resolution time metrics and aging tickets: Pinpoint bottlenecks in the support process and optimize workflows for faster resolution times.
- Agent performance and workload distribution: Ensure balanced workloads and identify opportunities for coaching and training.
- Customer satisfaction scores (CSAT) visualization: Track customer satisfaction trends and identify areas for improvement.
Pros:
- Provides real-time visibility into support operations.
- Helps identify knowledge gaps in the support team.
- Enables proactive management of at-risk SLAs.
- Facilitates data-driven staffing decisions.
Cons:
- Can create focus on metrics over quality of resolution if not managed carefully.
- Requires Jira Service Management for full functionality.
- May need customization for specific support workflows.
Website: https://www.atlassian.com/software/jira/service-management
Pricing and Technical Requirements:
Jira Service Management is a paid add-on for Jira. Pricing varies depending on the number of agents. Check the Atlassian website for the most up-to-date pricing information and technical requirements.
Implementation Tip:
Start with a pre-built template and customize it to fit your specific workflows. Define clear metrics and goals for your team, and regularly review the dashboard to identify areas for improvement. Integrating this dashboard with tools like HubSpot can provide even deeper insights into customer interactions and improve overall support effectiveness. Consider using the HubSpot for Jira app to connect customer data with support tickets for a more comprehensive view.
This Service Desk and Customer Support Dashboard earns its place on this list because it provides a focused, actionable view of critical support metrics. It empowers support teams to deliver timely, efficient service while continuously improving their processes. This example highlights how Jira dashboards can be tailored for specific team needs, making Jira a versatile tool for various departments and use cases.
6. Release Management Dashboard: Streamlining Releases with Jira
A Release Management Dashboard in Jira offers invaluable insights into the complex world of software and product releases. This dashboard example is crucial for teams aiming for predictable and successful deployments, particularly those utilizing agile methodologies and dealing with intricate release cycles. It centralizes key information, enabling release managers and stakeholders to monitor progress, identify potential roadblocks, and ultimately ensure smooth releases. This is particularly beneficial for teams who also leverage HubSpot for CRM, enabling them to connect release information with customer-facing teams and activities. This type of jira dashboard examples showcases how powerful Jira can be for managing complex projects.
This example deserves its place on this list due to its focus on a critical aspect of software development: releases. While other dashboards might focus on individual sprints or projects, the Release Management Dashboard takes a higher-level view, coordinating all the moving parts that contribute to a successful launch.
Features and Benefits:
The core functionality of this jira dashboard examples revolves around providing a clear picture of the release pipeline. Key features include:
- Release burnup/burndown charts: Visualize the progress towards release completion, allowing teams to track velocity and identify potential delays. This is particularly important for teams aiming to use data-driven insights, aligning with revenue operations and reporting needs.
- Feature completion and readiness tracking: Track the status of individual features slated for a release, ensuring all dependencies are met and everything is ready for deployment. This granular view allows product managers using Jira to effectively manage feature rollouts and communicate updates to sales and marketing through HubSpot.
- Release blocker and dependency visualization: Quickly identify and address bottlenecks that could impede the release schedule. This is invaluable for proactive risk management. Integrating this information with HubSpot can help customer support teams anticipate potential issues and prepare appropriate communication for clients.
- Version status and go-live readiness indicators: Clear indicators provide at-a-glance status updates on the release's readiness for deployment, simplifying communication across teams.
- Release notes generation and history: Automate the creation and maintenance of release notes, providing a comprehensive record of changes for both internal teams and external stakeholders. This feature can integrate with HubSpot to automatically update customer-facing documentation and knowledge bases.
Pros:
- Creates transparency across teams about release status: Everyone involved has access to the same information, fostering better communication and collaboration. This transparency is amplified when combined with HubSpot, allowing customer-facing teams to align their activities with product releases.
- Helps identify risks to release schedules early: Proactive risk identification empowers teams to mitigate potential problems before they escalate, leading to more predictable release cycles.
- Facilitates coordination between multiple teams: The dashboard acts as a central hub for coordinating dependencies between development, testing, and operations teams.
- Provides historical data for improving release planning: Analyzing past release data enables teams to identify patterns, refine processes, and optimize future releases. This historical data can also be integrated with HubSpot's analytics tools for a comprehensive view of product performance and customer impact.
Cons:
- Requires consistent version and release management practices: To fully leverage the dashboard, teams need established processes for managing versions and releases.
- Can be complex to set up for products with many components: Configuring the dashboard for highly complex products requires careful planning and organization.
- May need additional plugins for enterprise-level release management: For advanced functionalities like automated deployment pipelines, additional Jira plugins or integrations with other tools might be necessary.
Implementation/Setup Tips:
- Start with a simplified version of the dashboard and gradually add more complexity as needed.
- Clearly define roles and responsibilities for maintaining the dashboard and updating information.
- Integrate the dashboard with your existing version control and CI/CD pipelines for automated updates.
- Leverage Jira's automation features to streamline workflows and reduce manual effort.
- Consider using the HubSpot for Jira integration to connect release data with customer-facing teams in HubSpot, enhancing communication and alignment.
Website: https://www.atlassian.com/software/jira/features/project-tracking
This jira dashboard examples highlights the power of Jira in managing complex releases. While pricing details for Jira vary based on the chosen plan and the number of users, the investment is justified by the improved efficiency, transparency, and predictability it brings to the release process. By integrating with HubSpot, teams can further enhance the value of this dashboard, ensuring that release information is seamlessly shared with relevant stakeholders, from marketing and sales to customer support. This interconnectedness fosters a customer-centric approach to product development and release management.
7. Team Performance Dashboard
Engineering managers and team leads often struggle to get a clear picture of their team's performance. They need to understand not just individual contributions, but also the overall team dynamics, productivity, and areas for improvement. A Team Performance Dashboard in Jira provides this crucial insight, balancing quantitative data with qualitative indicators for a holistic view of team health. This makes it a valuable Jira dashboard example for any team aiming to improve their efficiency and collaboration.

This dashboard deserves a place on this list due to its focus on actionable insights. Features like team velocity and capacity utilization charts, work distribution visualizations, and issue resolution time breakdowns empower data-driven decision-making. For instance, by visualizing work distribution, managers can identify bottlenecks and ensure an even workload. Tracking issue resolution time helps pinpoint areas where process improvements are needed.
By combining metrics like code review collaboration indicators with work quality metrics such as bug rates and technical debt, the dashboard provides a comprehensive perspective. This data becomes invaluable for team retrospectives, enabling objective discussions around performance and identifying areas for growth. It also allows managers to identify team members who may need additional support, fostering a more supportive and collaborative environment. Learn more about Team Performance Dashboard]
Features:
- Team velocity and capacity utilization charts
- Work distribution and collaboration patterns
- Issue resolution time by type and priority
- Code review metrics and collaboration indicators
- Work quality metrics (bugs, rework, technical debt)
Pros:
- Provides objective data for team retrospectives
- Helps identify team members who may need support
- Enables better capacity planning and work allocation
- Creates visibility into team improvements over time
Cons:
- Can lead to unhealthy competition if used for comparison
- Metrics may not capture all aspects of team contribution
- Requires careful interpretation to avoid misuse
- May need additional eAgile plugins for comprehensive metrics
Website: https://www.atlassian.com/software/jira/features/reports
Implementation/Setup Tips:
While Jira provides built-in reporting functionalities, consider enhancing your Team Performance Dashboard with a HubSpot integration. Connecting Jira with your CRM allows you to track customer-related issues, link support tickets to development work, and gain a deeper understanding of the customer impact of your team’s performance. This is especially powerful for support and product teams. Syncing data between HubSpot and Jira provides a more comprehensive view of team performance within the broader context of customer satisfaction and business goals. Look for integrations on the Atlassian Marketplace that offer features like two-way data sync and automatic ticket creation. These integrations streamline workflows and centralize information, further empowering your team to focus on delivering high-quality work.
Connecting to the Broader Topic of Jira Dashboard Examples & HubSpot Integration:
This example highlights the power of Jira dashboards for specific use cases like team performance monitoring. However, the true potential of Jira is unlocked when integrated with other tools like HubSpot. This connection enables teams to align their work with broader business objectives and gain valuable insights into the customer impact of their efforts. For example, by syncing customer feedback from HubSpot into Jira, product teams can prioritize features and bug fixes based on real-time customer needs. This level of integration elevates Jira dashboards from simple project tracking tools to powerful business intelligence hubs. Looking for more Jira dashboard examples? Consider exploring dashboards focused on customer satisfaction, sales pipeline performance, or marketing campaign effectiveness, all enhanced by the rich data available through a HubSpot integration.
7 Jira Dashboard Examples Comparison
| Dashboard | Core Features & Metrics | User Experience & Quality ★ | Target Audience 👥 | Unique Selling Points ✨ | Price & Value 💰 |
|---|---|---|---|---|---|
| Agile Project Management | Sprint burndown, velocity, backlog health, issue distribution | Real-time, helps bottleneck ID ★★★★ | Scrum/Agile teams | Data-driven sprint planning, resource allocation ✨ | Included in Jira |
| DevOps Performance | Cycle time, deployment frequency, code quality, incident tracking | Clear DevOps metrics, supports DORA ★★★★ | Dev & Ops teams | Bridges Dev & Ops, CI/CD integration ✨ | Included in Jira |
| Executive Overview | Project health (RAG), resource allocation, budget tracking | High-level, executive-friendly ★★★ | Leadership & Stakeholders | Simplified KPIs, risk & milestone tracking ✨ | Included in Jira |
| Bug Tracking & Quality Assurance | Bug rates, test coverage, regression tracking | Centralized QA data, early warnings ★★★★ | QA & Developers | Quality trends, bug prioritization ✨ | Included in Jira |
| Service Desk & Customer Support | SLA compliance, ticket volume, resolution times, CSAT scores | Real-time support insights ★★★★ | Support teams | SLA alerts, workload balancing ✨ | Jira Service Management |
| Release Management | Release burnup, feature readiness, blockers, go-live status | Transparency on release status ★★★ | Release Managers | Dependency visualization, release notes ✨ | Included in Jira |
| Team Performance | Velocity, capacity, collaboration, code reviews, work quality | Holistic team health ★★★★ | Engineering Managers | Balances quantitative & qualitative data ✨ | Included in Jira |
Elevate Your Jira Experience with HubSpot Integration
Throughout this article, we've explored seven powerful Jira dashboard examples, ranging from Agile project management and DevOps performance to customer support and release management. These examples showcase how Jira dashboards can be tailored to meet the unique needs of various teams, providing critical insights into project progress, team performance, and overall business health. Key takeaways include understanding the importance of clear metrics, visualized data, and real-time updates for effective decision-making. Whether you're a DevOps manager tracking sprint velocity or a marketing team monitoring lead conversion rates, a well-configured Jira dashboard is essential for success.
Choosing the right tools and setting them up effectively is paramount to maximizing the value of your Jira dashboards. Consider your specific team needs, data sources, and reporting requirements when selecting tools. Factors like data integration capabilities, customization options, and ease of use should be carefully evaluated. If you're looking for more visual ways to manage your workflow, Kanban boards can be a great option. Check out these helpful resources: Kanban board examples from Tooling Studio.
To further optimize your Jira experience and break down data silos, consider integrating your Jira instance with your HubSpot CRM. This integration can streamline workflows by syncing data between both platforms, automating ticket creation, and providing a holistic view of customer interactions alongside project development. This is particularly valuable for teams that rely on both Jira and HubSpot for daily operations.
Seamless data synchronization is crucial for making informed decisions. By connecting HubSpot and Jira, you gain a unified perspective, enabling better collaboration, improved customer service, and enhanced reporting capabilities across all teams. This synergistic combination can create a more dynamic and responsive environment, empowering you to identify trends, anticipate potential issues, and proactively address customer needs.
Empower your teams to make data-driven decisions and achieve optimal performance with a tightly integrated toolset. By leveraging the power of Jira dashboards and integrating them with HubSpot through resolution Reichert Network Solutions GmbH, you can unlock a new level of efficiency and collaboration. Want to streamline your workflows and gain a holistic view of your customer journey alongside your project development? Try resolution Reichert Network Solutions GmbH for Jira today! resolution Reichert Network Solutions GmbH provides seamless integration between HubSpot and Jira, enriching your Jira dashboard examples with crucial CRM data and facilitating powerful, data-driven decision-making.
