

Let’s be honest—nobody gets excited about project progress reporting. It often feels like a frantic, last-minute scramble to pull together data for a report that’s already out of date by the time anyone reads it. It’s an obligation, not a tool.
The raw truth is that most of these reports are simply ineffective. They tell a story of what’s already happened instead of guiding what should happen next. This turns a critical communication process into mere busywork.
Why Your Project Reports Aren’t Working
If we’re getting brutally honest, no one enjoys creating—or reading—a dense, text-heavy report cobbled together from clunky, outdated spreadsheets. The fundamental problem is that traditional reporting methods are broken. They’re reactive, incredibly time-consuming, and fail to deliver the one thing everyone desperately needs: clear, actionable insights.
This disconnect is more than just a minor annoyance; it’s a massive drain on company resources. In fact, subpar project management practices, which absolutely include poor progress reporting, can waste around 12% of an organization’s resources. That’s a huge chunk of time and money going down the drain. If you’re curious about the broader impact, you can explore the research on project management statistics.
This isn’t just a hunch. The data shows a clear link between consistent reporting and better outcomes.
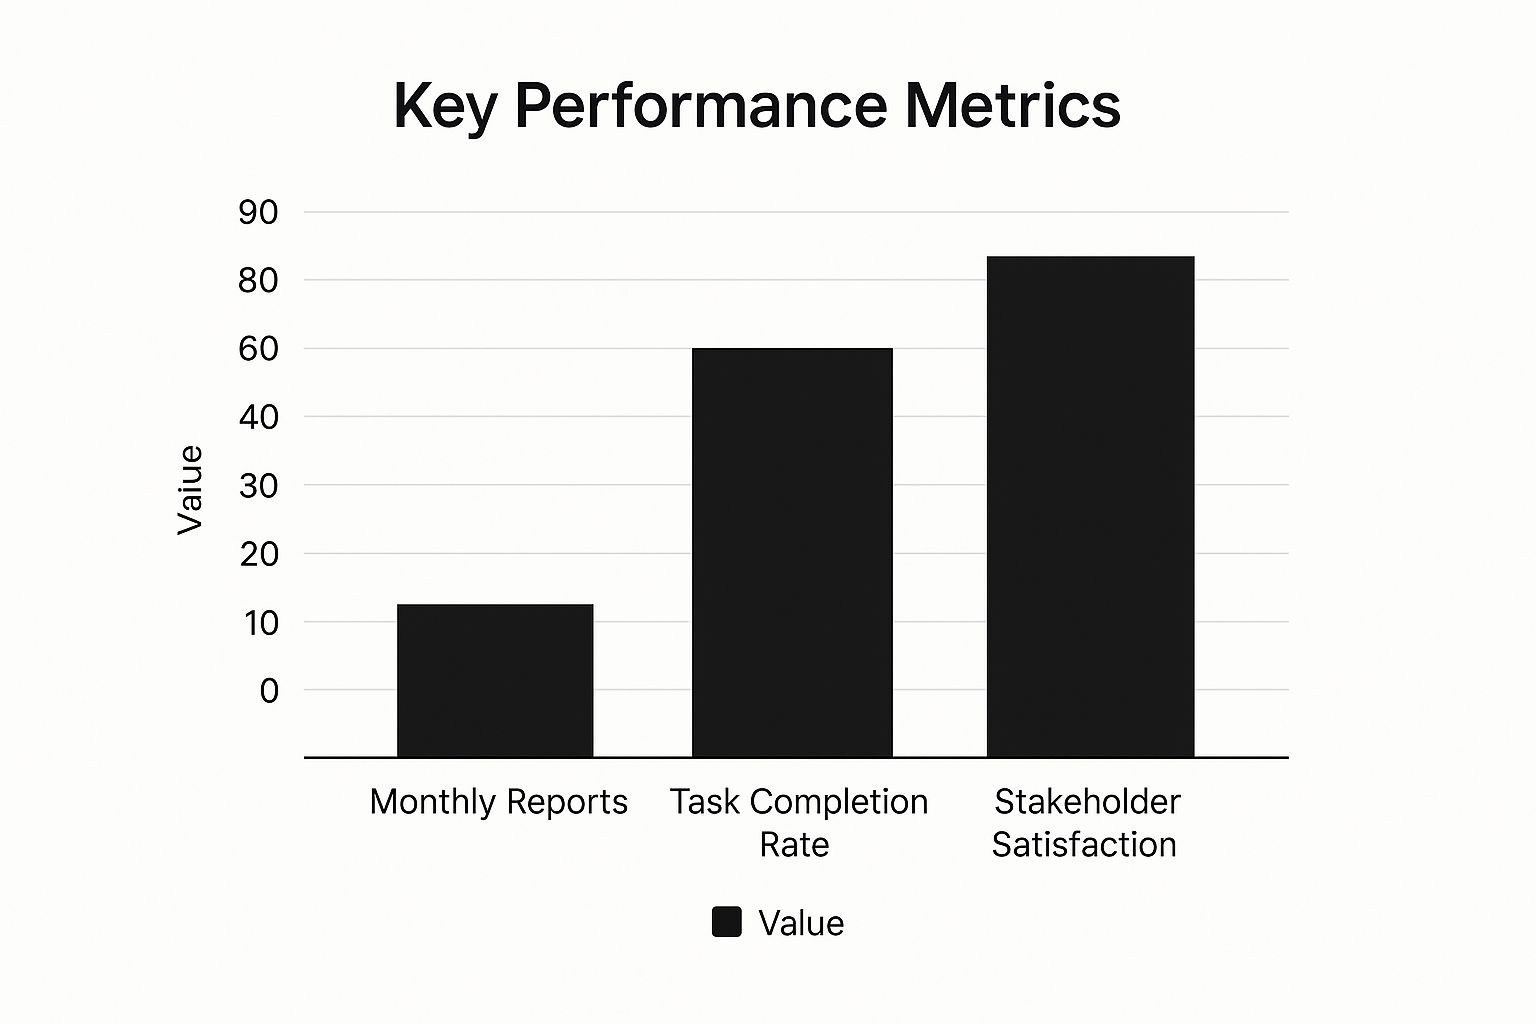
When you establish a steady communication rhythm, you see task completion rates hold steady and stakeholder satisfaction climb. It’s all connected.
Shifting from Outdated to Modern Reporting
To fix this, we need a complete mental shift. It’s time to move away from the old, painful way of doing things and embrace a more modern approach. I’ve seen firsthand how a change in mindset can transform reporting from a chore into a strategic advantage.
Here’s a look at the two competing mindsets. Which side do you fall on?
Traditional vs Modern Reporting Mindsets
| Characteristic | Traditional Reporting (The Problem) | Modern Reporting (The Solution) |
|---|---|---|
| Focus | Backward-looking (what happened) | Forward-looking (what’s next) |
| Content | Data dumps and task lists | Insights, narrative, and recommendations |
| Goal | Fulfill an obligation | Drive decisions and align the team |
| Frequency | Inconsistent or “when asked” | Rhythmic and predictable |
| Format | Static documents (PDFs, spreadsheets) | Dynamic, often visual dashboards |
| Audience | One-size-fits-all | Tailored to the specific audience |
This table really crystalizes the difference. You’re not just changing a process; you’re changing a philosophy. Moving to a modern reporting model is about creating clarity, not more documents.
The goal is to turn your reports from a historical archive into a strategic weapon. Here’s what sets a modern report apart:
- It tells a story. Instead of just listing tasks, a great report builds a narrative about the project’s journey—where you are, where you’re headed, and what roadblocks are in the way.
- It delivers insights, not just data. It proactively answers the “so what?” question. It’s not enough to say “we’re 50% complete.” You need to explain what that actually means for the timeline, budget, and final delivery.
- It’s designed for its audience. The information is customized. Executives get a high-level summary they can digest in minutes, while the project team gets the granular details they need to take immediate action.
The most effective project progress reporting feels less like a formal audit and more like a strategic conversation. It’s about building trust and alignment through transparent, consistent communication.
Ultimately, turning your reporting around means shifting from a mindset of obligation to one of opportunity. When you get it right, your reports become a powerful engine for driving success, not just a rearview mirror for documenting it.
Choosing Project Metrics That Actually Matter

Drowning in data but starved for insights? It’s a classic project management headache. The trick to effective project progress reporting isn’t about tracking every single thing you can. It’s about tracking the right things.
Too many teams get caught up in vanity metrics. Sure, closing out 100 tasks this week sounds great on paper. But what if 80 of them were minor tweaks, while the two most critical tasks are now dangerously behind schedule? This is exactly where you need to separate the meaningful KPIs from the noise.
Leading vs. Lagging Indicators
The real secret to insightful reporting is balancing two kinds of metrics: leading and lagging indicators. Think of it like you’re driving a car.
Lagging indicators are your rearview mirror—they show you where you’ve been. Leading indicators are your windshield and your GPS, showing you what’s coming up.
-
Lagging Indicators: These measure past performance and are usually pretty easy to track. They tell you the final score of events that already happened. Think Budget Variance (how much you’ve over or under-spent) or Schedule Variance (how far ahead or behind you are).
-
Leading Indicators: These are more predictive and help you forecast what’s likely to happen next. They give you a shot at course-correcting before it’s too late. Metrics like Team Velocity (the amount of work a team knocks out in a sprint) or Task Cycle Time (the total time from starting a task to calling it done) are powerful leading indicators.
A healthy reporting dashboard needs a mix of both. Lagging indicators confirm how you did, while leading indicators give you a heads-up about trouble on the horizon.
Defining Metrics for Your Project Type
Here’s the thing: the best metrics are never one-size-fits-all. They have to be tied directly to your project’s specific goals. A software development team is going to care about a completely different set of numbers than a marketing team launching a campaign.
For example, a software team might obsess over bug resolution time and code churn. These metrics give you a real, unfiltered look at product quality and development efficiency. If you’re on a software team and pulling this data together is a nightmare, you might want to see how a HubSpot Jira integration could centralize that information for clearer reporting.
On the other hand, a marketing campaign’s success is measured by different numbers entirely. Their world revolves around outcomes like:
- Cost Per Lead (CPL)
- Conversion Rate
- Customer Acquisition Cost (CAC)
These numbers directly tie the campaign’s performance to the business’s bottom line—a much clearer picture of success than just counting how many social media posts went out the door.
The most powerful metrics are those that directly link team activities to the project’s core objectives. If you can’t draw a straight line from the metric to the project goal, it’s probably not worth tracking.
Choosing the right metrics is the foundation of any reporting system that’s actually useful. By focusing on a small, powerful set of leading and lagging indicators that speak directly to your project’s goals, you stop dumping data on people and start providing a strategic tool that drives real decisions.
Designing Reports Your Stakeholders Will Read
Let’s be honest. A brilliant, data-rich report is completely useless if it just sits unread in someone’s inbox. I’ve seen it happen countless times. The real secret to effective project reporting isn’t just about what you share, but how you share it. Your design and format have to be built for your audience.
Think about it from their perspective. A C-level executive doesn’t have the time to dig through granular task lists, and a developer won’t get what they need from a high-level budget summary. The goal is to match the message to the recipient, ensuring your hard work actually lands with impact.
Tailor the Format to the Audience
One of the biggest mistakes project managers make is creating a one-size-fits-all report. It’s a recipe for disengagement. Different stakeholders have vastly different needs, concerns, and levels of project involvement, and your reporting needs to reflect that reality.
Your executive team, for example, needs a quick, scannable overview that lets them gauge the project’s health in 60 seconds or less. Your project team, on the other hand, needs all the nitty-gritty details to spot and solve problems on the ground.
To make this practical, here’s a quick breakdown of how you can match your reporting format to your stakeholders.
Reporting Format by Stakeholder
| Stakeholder | Best Report Format | Key Metrics to Include |
|---|---|---|
| C-Level Executives | One-Page Executive Summary or a Visual Dashboard | Overall ROI, Budget vs. Actual, Major Milestones, High-Level Risks |
| Project Team | Detailed Task Board or a Burn-down Chart | Task Status, Blockers, Sprint Velocity, Upcoming Deadlines |
| Clients/Customers | High-Level Progress Report with Visuals | Timeline Progress, Key Deliverables Completed, Next Steps |
| Department Heads | Hybrid Report (Summary + Key Details) | Resource Allocation, Cross-functional Dependencies, Impact on Their Team |
By tailoring the report, you ensure everyone gets exactly the information they need without the noise they don’t. This focus on efficient communication is a huge reason the project management software market, once valued at $7.24 billion, is projected to soar past $10 billion by 2026.
Visuals Speak Louder Than Words
Never, ever underestimate the power of a simple visual cue. Our brains are wired to process images and patterns far faster than dense blocks of text, which makes visual reporting incredibly effective for busy stakeholders.
One of the most powerful and simple tools in your arsenal is the RAG (Red-Amber-Green) status. It’s a universally understood system that cuts through the complexity:
- Green: All good. The project is on track with no major issues.
- Amber: Heads up. There are potential risks or minor delays that need attention.
- Red: Sound the alarm. The project is off-track and needs immediate intervention.
This simple color-coding allows anyone, from the CEO down to an intern, to understand a project’s health at a single glance. Many modern tools make this easy, and you can learn a lot about generating reports in Jira to help automate this very process.
For agile teams, the burn-down chart is king. It provides a crystal-clear visual representation of work remaining versus time. A steep, steady downward slope is a beautiful sight; a flat or upward-trending line is an immediate call to action.
While we’re focused on project progress, the principles of clear report design are universal. For instance, understanding how to structure information for compliance, as detailed in this Exempt Reporting Advisers Key Compliance Guide, offers fantastic insights. The core idea is always the same: deliver clarity, relevance, and accessibility to your audience.
Finding Your Perfect Reporting Rhythm

What’s the right schedule for your progress reports? Weekly? Bi-weekly? Daily? Getting this wrong is a classic project management pitfall.
Report too often, and you just create a storm of noise that everyone starts to ignore. But report too infrequently, and a tiny problem can easily snowball into a full-blown crisis before anyone even notices.
The sweet spot isn’t about picking a random interval. It’s about syncing your communication with the project’s actual heartbeat. When you establish a predictable rhythm, you build trust and cut down on anxiety for everyone, from your team on the ground to the execs in the boardroom.
Match Cadence to Project Type and Pace
The perfect reporting rhythm is never one-size-fits-all. You have to tailor it to the unique speed and complexity of your project. Mismatched reporting is a huge mistake—it’s like asking for hourly updates on a house that’s going to take six months to build. It just doesn’t make sense.
Think about these different project environments:
- Fast-Paced Agile Projects: For teams running in one or two-week sprints, a weekly summary is usually perfect. It lines up with the sprint cycle, wraps up what was accomplished, flags any blockers, and tees up the week ahead. Your daily stand-ups are there for the tactical, micro-level updates.
- Long-Term Infrastructure Projects: For something like a year-long construction project or a massive IT infrastructure rollout, weekly reports would be a waste of time, full of fluff. A detailed monthly report makes way more sense here. It can provide a substantial update on major milestones, budget burn, and overall timeline health.
- Marketing Campaigns: These often land somewhere in the middle. A bi-weekly report can be the ideal middle ground for a three-month campaign, allowing you to capture meaningful shifts in metrics like lead gen or ad performance without overwhelming everyone.
A huge part of matching the cadence is simply knowing who is working on what and when. This is where solid resource management becomes critical. For teams on Jira, getting a clear view of team capacity is a game-changer. You can learn more about practical Jira resource management to better align workloads with your reporting cycles.
Handling the Dreaded Ad-Hoc Request
No matter how perfect your reporting rhythm is, the “Can you just pull a quick report on…?” request is inevitable. If you’re not careful, these can completely derail your team’s focus.
The best defense against ad-hoc report chaos is a good offense. By establishing a predictable and trusted reporting schedule, you train stakeholders to expect key information at regular intervals, naturally reducing their ad-hoc queries.
So, when a surprise request does land in your inbox, don’t just drop everything. First, assess its actual urgency. Is this a genuine fire that needs putting out, or is it just a case of stakeholder curiosity?
Often, you can gently push back by saying, “Great question! That’s something we’ll be covering in detail in our scheduled Friday report. Can it wait until then?” This shows you value their question while still protecting your team’s time and workflow.
Let’s be honest: manually creating project progress reports is a one-way ticket to burnout. It’s a soul-crushing cycle of chasing people for data, copy-pasting into spreadsheets, and praying you didn’t bungle a formula somewhere along the way. That’s not project management; it’s being a data janitor.
It’s time to let technology do the heavy lifting. Automated reporting isn’t some far-off concept—it’s a basic necessity for any modern team. The tools you already use are built to turn raw project data into insightful, real-time reports with just a few clicks.
Your PM Tool is a Reporting Engine in Disguise
That project management platform your team lives in every day—whether it’s Jira, Asana, or ClickUp—is secretly a powerhouse reporting engine. The trick is to stop seeing it as just a glorified to-do list. Treat it as your single source of truth, and you’ll immediately put an end to the chaos of conflicting data scattered across random docs and spreadsheets.
Getting started is simpler than you think:
- Build a Live Dashboard: Spend some real time exploring the native dashboard features. Pull in charts that show task completion rates, add widgets for team workload, and map out your key milestones on a timeline. Make it your project’s command center.
- Schedule Automated Reports: Dive into the settings and have your platform automatically email key reports to stakeholders. Imagine a perfect summary landing in your executive’s inbox every Monday at 9 AM sharp, without you lifting a finger.
The core principle is always the same, no matter your industry: automate the repetitive so you can focus on the important. This is true for all kinds of businesses looking to streamline operations and reporting by slashing administrative overhead.
The numbers don’t lie. As this visual from ClickUp shows, teams using dedicated software see huge jumps in productivity and communication. These tools are no longer a “nice-to-have.”
The real magic of automation isn’t just about saving a few hours. It’s about accuracy. When reports pull directly from the source, you kill the risk of human error. Your decisions get based on reality, not on a typo from a rushed copy-paste job.
Connect Your Tools for a Complete Picture
Of course, project data rarely lives in just one place. You might track engineering tasks in Jira but manage your sales pipeline in a completely different CRM. This is where automation gets really powerful.
When you connect these separate systems, you create a seamless flow of information that makes your reporting truly intelligent.
For example, a simple integration can create rules that automatically update project status based on triggers from other apps. A sales lead is marked “won” in your CRM? Boom—an integration can instantly fire off a new “Project Kickoff” task in your PM tool. This is the heart of a powerful, automated workflow. For teams on Jira, it’s absolutely worth digging into the world of Jira workflow automation to see how you can link different steps and tools together.
Creating this connected ecosystem means your reports are always built on the most current information from across the entire business. They’re not just accurate anymore—they’re truly comprehensive.
Common Questions About Project Reporting

Even with the best templates and a solid process, the reality of project reporting always throws a few curveballs. I’ve seen it happen time and again. Let’s get into some of the questions that pop up most often and give you some straight, practical answers.
How Do I Report on a Project That Is Off-Track?
This is the one report everyone dreads writing. But in my experience, trying to hide or downplay problems is the single biggest mistake you can make. Your stakeholders are smart; they’ll sense when something’s wrong.
Your first move? Be direct. If the project is red, call it red. Use your RAG status and put it front and center. Immediately follow that up by explaining why. Did scope creep finally catch up to you? Is a key resource tied up elsewhere? Be specific about the root cause.
The most important part, though, is your recovery plan. This is where you shift the focus from blame to solutions. Your report needs to clearly lay out the exact steps you’re taking to get back on course. This might mean adjusting the timeline, tweaking the budget, or re-negotiating scope, but you need to present a concrete plan.
Your credibility hinges on transparency. A report that tackles a problem head-on and proposes a clear fix builds far more trust than one that tiptoes around the issue. It shows you’re still in command, even when things have gone sideways.
What Is the Difference Between a Status and Progress Report?
This is a classic point of confusion, but getting it right is key to managing stakeholder expectations. The easiest way to think about it is a snapshot versus a feature film.
A status report is your snapshot. It’s tactical, tight, and focused on a very specific timeframe. Think “Here’s what we did last week, and here’s what’s up next.” It’s perfect for keeping the team aligned on a day-to-day or week-to-week basis.
A progress report is the full movie. It takes a much more strategic view, measuring performance against the entire project plan from the very beginning. This is where you zoom out to look at the big picture: budget variance, overall risk level, and how close you are to hitting major milestones. If you want to dive deeper into these kinds of metrics, our guide on how to measure project success is a great resource.
How Much Detail Should I Include in My Reports?
The golden rule here is simple: know your audience. There’s no such thing as a one-size-fits-all report. Sending the wrong level of detail is one of the fastest ways to get your reports ignored.
- For Executives: They need the 30,000-foot view, and they need it fast. Give them a high-level summary with the key KPIs, the overall RAG status, and a quick sentence on any major risks. They should understand the project’s health in less than a minute.
- For Your Team: This is where you get granular. Your team needs to know the specifics—individual task statuses, critical dependencies, and any immediate blockers they need to help clear. This report is their playbook for the next sprint.
Always tailor the content. The goal isn’t to dump all the data you have; it’s to give each stakeholder exactly what they need to make their next decision.
Ready to stop the reporting chaos and unify your project management? With resolution Reichert Network Solutions GmbH, you can embed monday.com boards directly into Jira, creating a single source of truth that powers real-time, automated reports. Bridge the gap between platforms and give every stakeholder the clear, accurate view they need.
See how monday.com for Jira can transform your reporting today!
